Technical Analysis of RSPS 2024-05-10
Overview:
In analyzing the technical indicators for RSPS over the last 5 days, we will delve into the trend, momentum, volatility, and volume indicators to provide a comprehensive outlook on the possible stock price movement in the coming days. By examining these key indicators, we aim to offer valuable insights and predictions for potential investors.
Trend Indicators:
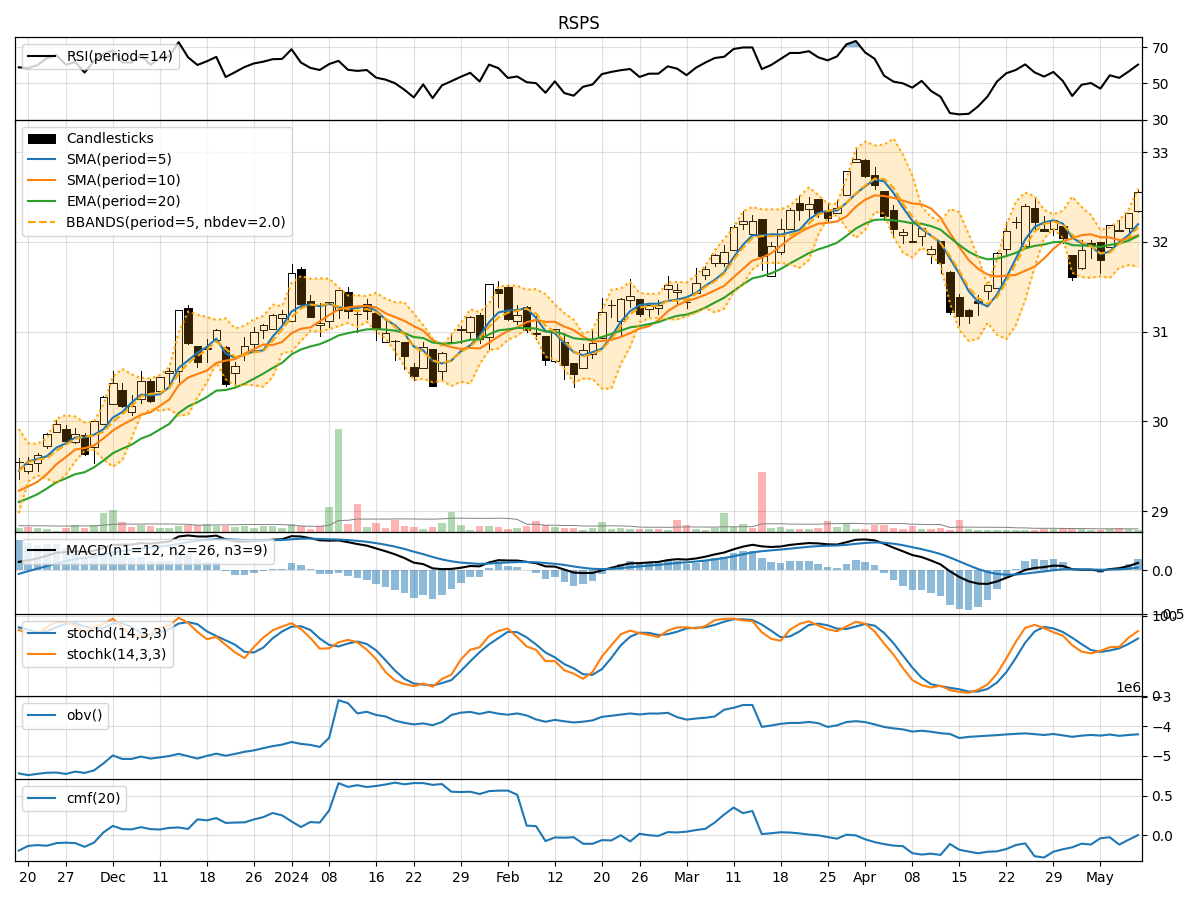
- Moving Averages (MA): The 5-day Moving Average (MA) has been fluctuating around the closing prices, indicating short-term price trends. The Simple Moving Average (SMA) and Exponential Moving Average (EMA) show a slight upward trend.
- MACD: The Moving Average Convergence Divergence (MACD) and its signal line (MACDh) have been consistently positive, suggesting bullish momentum.
Momentum Indicators:
- RSI: The Relative Strength Index (RSI) has been gradually increasing, indicating strengthening buying pressure.
- Stochastic Oscillator: Both %K and %D lines of the Stochastic Oscillator are in the overbought region, signaling a potential reversal or consolidation.
Volatility Indicators:
- Bollinger Bands (BB): The Bollinger Bands are widening, indicating increased price volatility.
Volume Indicators:
- On-Balance Volume (OBV): The OBV has been declining, suggesting a divergence between price and volume movements.
- Chaikin Money Flow (CMF): The CMF has been negative, indicating selling pressure in the market.
Key Observations:
- The trend indicators suggest a short-term bullish sentiment with moving averages pointing upwards and positive MACD values.
- Momentum indicators show a mixed signal with RSI indicating buying pressure while the Stochastic Oscillator suggests a potential reversal.
- Volatility indicators point towards increasing price volatility, which may lead to larger price swings.
- Volume indicators reflect a divergence between price and volume movements, indicating a potential lack of confirmation in the current price trend.
Conclusion:
Based on the analysis of the technical indicators, the next few days' possible stock price movement for RSPS could be sideways to slightly bullish. While the trend indicators and RSI signal a bullish sentiment, the overbought Stochastic Oscillator and negative CMF raise concerns about a potential reversal or consolidation. Investors should closely monitor price movements and volume dynamics for confirmation of the predicted trend.