Technical Analysis of RSPU 2024-05-10
Overview:
In analyzing the technical indicators for RSPU over the last 5 days, we will delve into the trend, momentum, volatility, and volume indicators to provide a comprehensive outlook on the possible stock price movement in the coming days. By examining these key aspects, we aim to offer valuable insights and predictions to guide your investment decisions.
Trend Analysis:
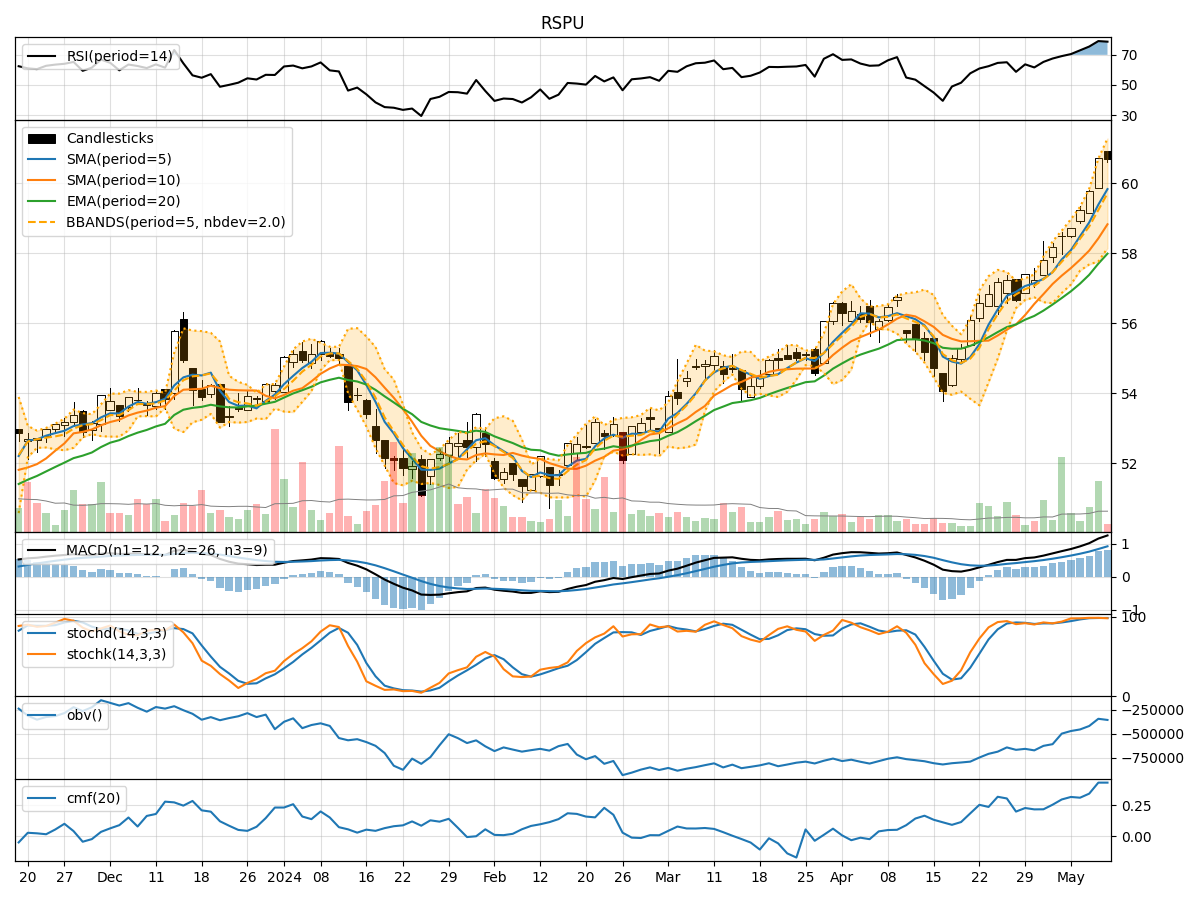
- Moving Averages (MA): The 5-day MA has been consistently above the closing prices, indicating a bullish trend.
- MACD: The MACD line has been above the signal line, suggesting a positive momentum in the stock price.
Key Observation: The trend indicators point towards a bullish sentiment in the stock price movement.
Momentum Analysis:
- RSI: The RSI values have been increasing, reaching overbought levels, signaling a strong bullish momentum.
- Stochastic Oscillator: Both %K and %D have been in the overbought zone, indicating a potential reversal or consolidation.
Key Observation: Momentum indicators reflect a strong bullish sentiment but also hint at a possible reversal or consolidation in the near future.
Volatility Analysis:
- Bollinger Bands (BB): The stock price has been trading near the upper Bollinger Band, suggesting high volatility.
Key Observation: Volatility indicators indicate high volatility in the stock price, which may lead to sharp price movements.
Volume Analysis:
- On-Balance Volume (OBV): The OBV has been increasing, indicating strong buying pressure.
- Chaikin Money Flow (CMF): The CMF has been positive, reflecting a bullish money flow into the stock.
Key Observation: Volume indicators suggest strong buying pressure and positive money flow into the stock.
Conclusion:
Based on the analysis of the technical indicators, the overall outlook for RSPU is bullish in the short term. The trend indicators support a bullish sentiment, while momentum indicators indicate a strong bullish momentum with a possibility of a reversal or consolidation. Volatility remains high, which could lead to sharp price movements. The volume indicators confirm strong buying pressure and positive money flow into the stock.
Recommendation:
Considering the bullish trend and momentum, investors may consider buying RSPU in the short term. However, it is essential to monitor the potential reversal or consolidation indicated by the momentum indicators. Traders should also be cautious of the high volatility and set appropriate stop-loss levels to manage risk effectively.
In conclusion, the next few days for RSPU are likely to see upward movement with potential for short-term fluctuations. It is crucial to stay vigilant and adapt to changing market conditions to make informed trading decisions.