Technical Analysis of RSST 2024-05-10
Overview:
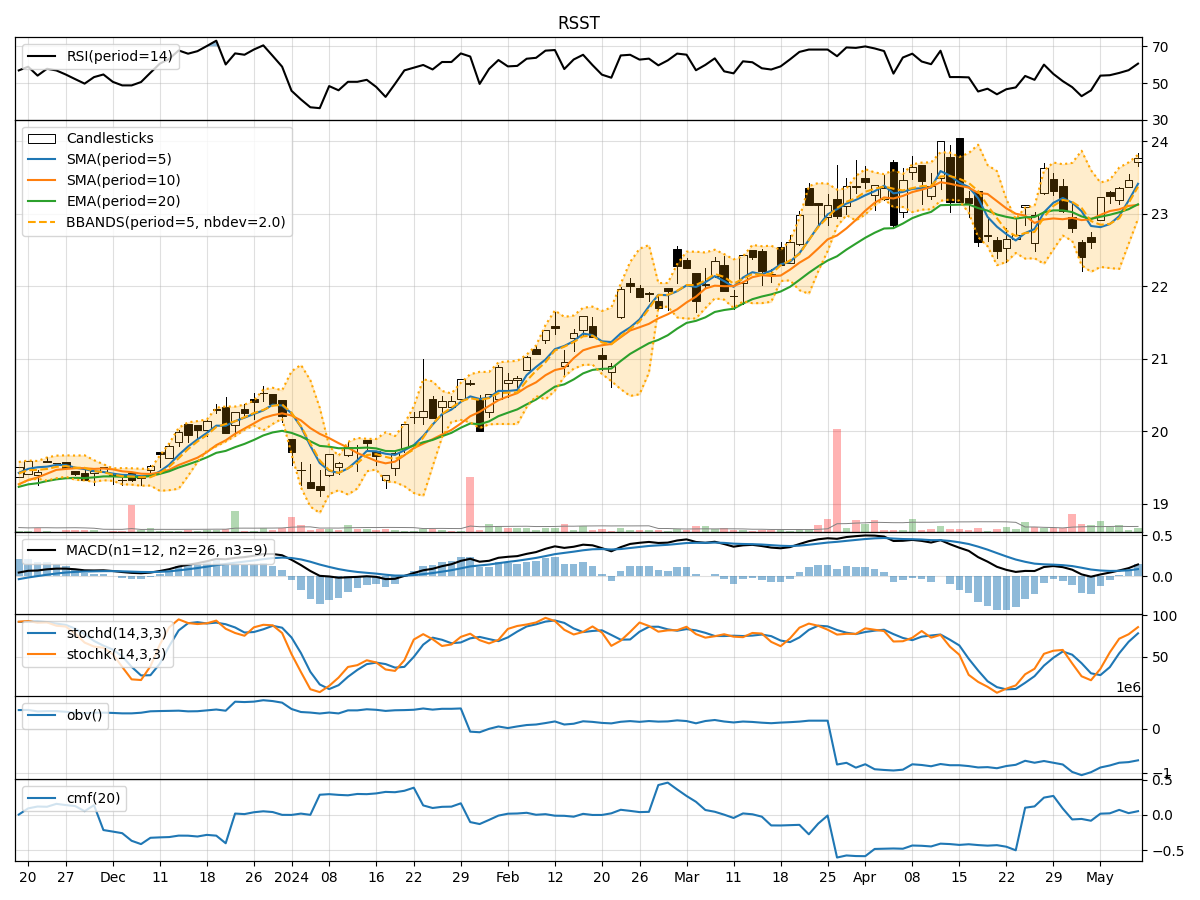
In the last 5 trading days, RSST stock has shown a consistent uptrend in both price and volume. The moving averages have been trending upwards, indicating a bullish sentiment. Momentum indicators like RSI and Stochastic oscillators are also showing strength in the stock. Volatility indicators suggest a moderate level of price fluctuation, while volume indicators reflect a positive accumulation of the stock.
Trend Analysis:
- Moving Averages (MA): The 5-day MA has been consistently above the 10-day SMA, indicating a short-term bullish trend. The EMA(20) is also trending upwards, supporting the bullish sentiment.
- MACD: The MACD line has been consistently above the signal line, with both lines trending upwards. The MACD histogram is also showing an increasing positive value, indicating strengthening bullish momentum.
Momentum Analysis:
- RSI: The RSI has been steadily increasing and is currently in the overbought territory above 70, suggesting a strong bullish momentum.
- Stochastic Oscillators: Both %K and %D lines are in the overbought zone, indicating a strong buying pressure. The stock is likely to continue its upward momentum in the short term.
Volatility Analysis:
- Bollinger Bands (BB): The stock price has been trading within the upper Bollinger Band, indicating an overbought condition. However, the bands are widening, suggesting increasing volatility.
- Bollinger %B (BBP): The %B is close to 1, indicating that the stock is trading at the upper band, which could signal a potential pullback or consolidation.
Volume Analysis:
- On-Balance Volume (OBV): The OBV has been consistently rising, indicating strong buying pressure and accumulation of the stock.
- Chaikin Money Flow (CMF): The CMF(20) is positive, suggesting that money is flowing into the stock over the past 20 days.
Conclusion:
Based on the technical analysis of RSST stock: - Trend: The stock is in a strong uptrend supported by moving averages and MACD. - Momentum: The momentum indicators suggest a bullish sentiment with overbought conditions. - Volatility: The stock is experiencing increasing volatility but is currently in an overbought state. - Volume: Accumulation and buying pressure are strong, indicating positive investor sentiment.
Overall Opinion:
Given the strong bullish trend, momentum, and volume accumulation, the next few days are likely to see continued upward movement in RSST stock price. However, traders should be cautious of potential pullbacks or consolidations as the stock is currently in overbought territory. It is advisable to closely monitor price action and key support levels for any signs of reversal.