Technical Analysis of RTAI 2024-05-10
Overview:
In analyzing the provided RTAI TA data for the last 5 days, we will delve into the technical indicators across trend, momentum, volatility, and volume to derive insights into the possible future stock price movement. By examining these indicators comprehensively, we aim to provide a well-informed prediction backed by data-driven analysis and expert interpretation.
Trend Analysis:
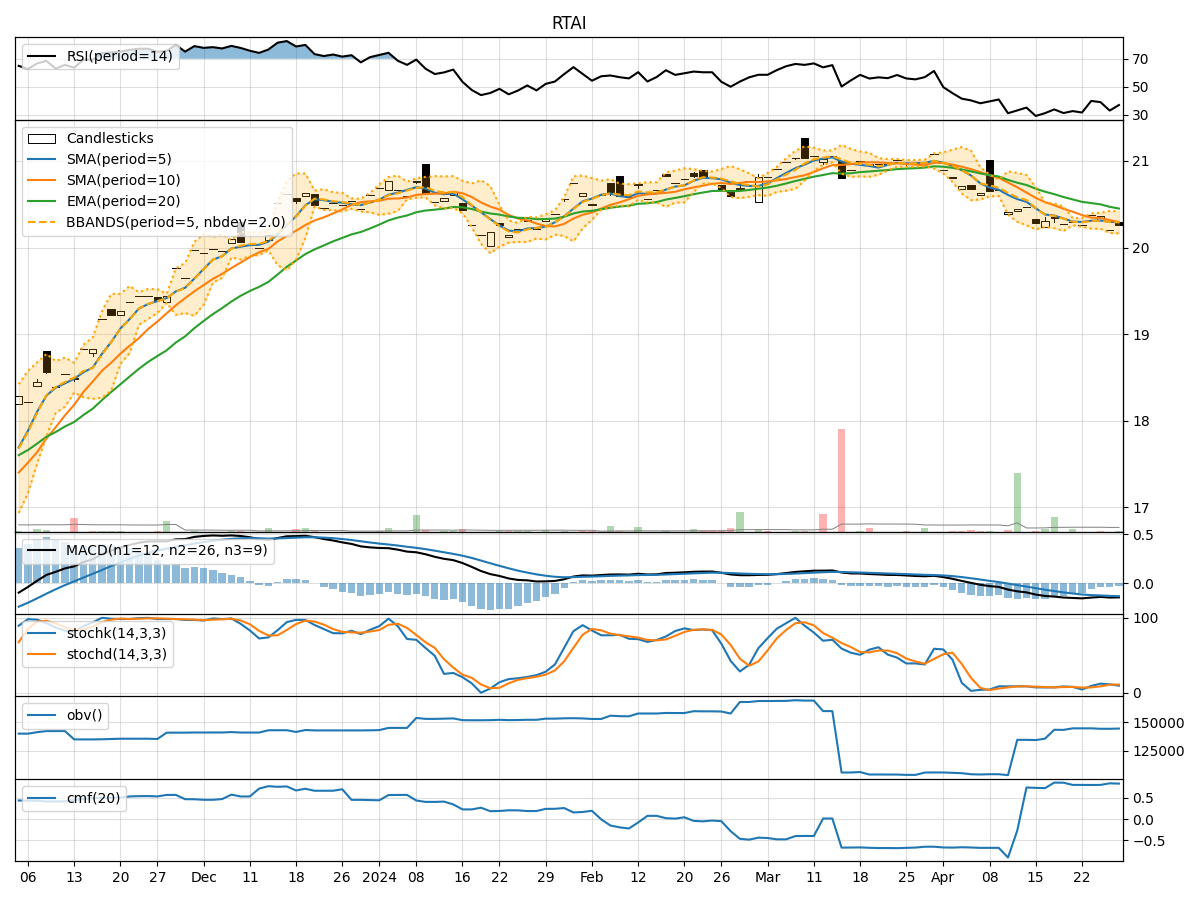
- Moving Averages (MA): The moving averages show a consistent uptrend over the last 5 days, with the closing price consistently above the short-term moving averages.
- MACD: The MACD line has been consistently positive, indicating a bullish trend.
- RSI: The RSI values have been in the neutral to slightly overbought territory, suggesting a potential continuation of the current uptrend.
Momentum Analysis:
- Stochastic Oscillator: The stochastic indicators have been gradually decreasing, moving from overbought levels towards oversold territory.
- Williams %R (WillR): The Williams %R values have been consistently in the oversold region, indicating a potential reversal or consolidation.
Volatility Analysis:
- Bollinger Bands (BB): The Bollinger Bands have been narrowing, indicating decreasing volatility and a potential upcoming breakout.
- BB% (BB Percentage): The BB% values have been decreasing, suggesting a possible period of consolidation before a significant price movement.
Volume Analysis:
- On-Balance Volume (OBV): The OBV values have been negative, indicating distribution and potential selling pressure.
- Chaikin Money Flow (CMF): The CMF values have been declining, signaling a decrease in buying pressure.
Conclusion:
Based on the analysis of the technical indicators: - Trend: The trend is bullish with strong support from moving averages and MACD. - Momentum: The momentum is weakening as stochastic indicators are moving towards oversold levels. - Volatility: Volatility is decreasing, suggesting a potential period of consolidation before a breakout. - Volume: The volume indicators show distribution and decreasing buying pressure.
Future Price Movement Prediction:
Considering the overall analysis, the stock is likely to experience a short-term consolidation phase before a potential bullish breakout. Traders should monitor the stochastic indicators for a possible reversal signal and keep an eye on the Bollinger Bands for the breakout confirmation. It is advisable to wait for a clear signal before entering a new position, as the stock may exhibit increased volatility during the consolidation phase.
Key Recommendations:
- Monitor Stochastic Oscillator: Watch for a reversal signal as the indicator approaches oversold levels.
- Confirm Breakout: Wait for a clear breakout confirmation from the narrowing Bollinger Bands.
- Exercise Caution: Be mindful of the decreasing volume and potential selling pressure indicated by OBV and CMF.
By staying vigilant and utilizing these insights, traders can make informed decisions and capitalize on the anticipated price movements in the coming days.