Technical Analysis of RTH 2024-05-10
Overview:
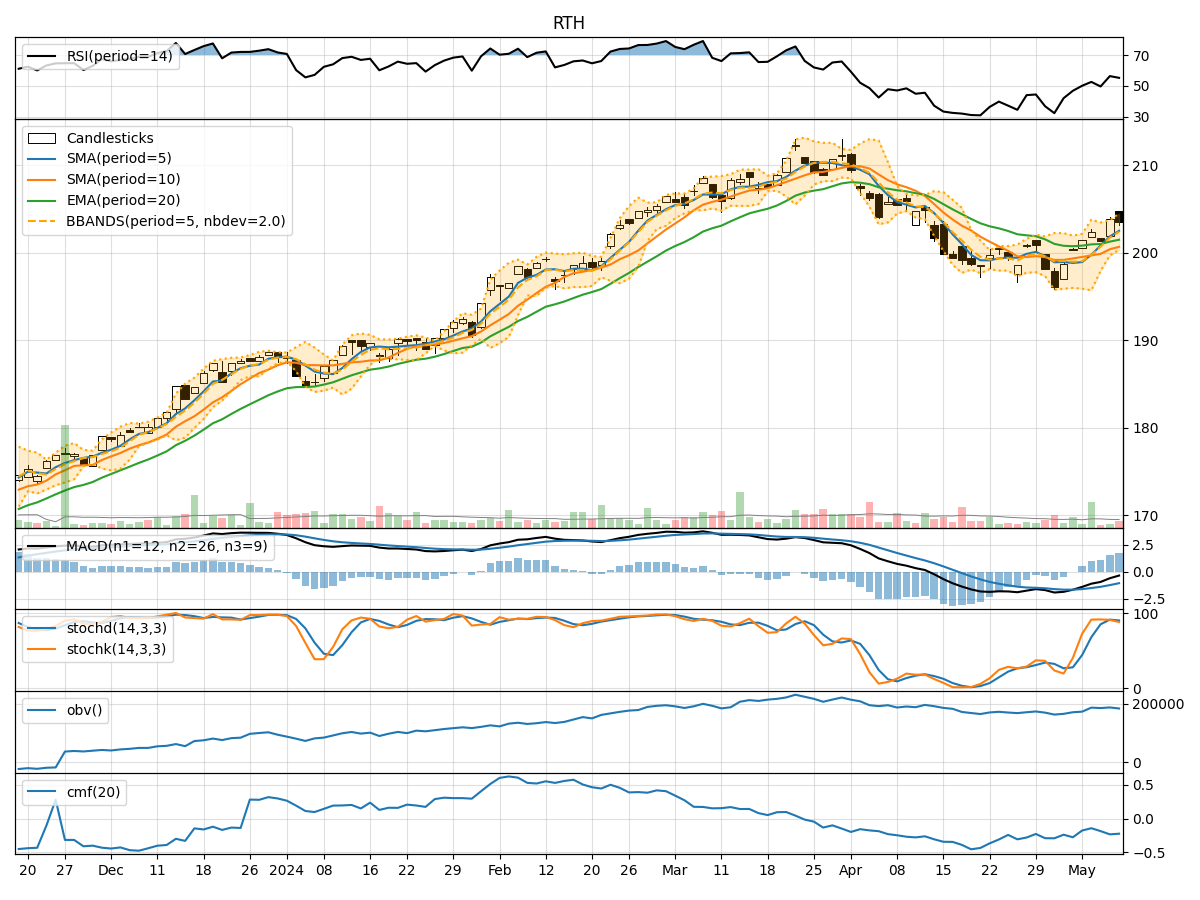
In analyzing the technical indicators for RTH over the last 5 days, we will delve into the trend, momentum, volatility, and volume indicators to provide a comprehensive outlook on the possible stock price movement in the coming days. By examining these key aspects, we aim to offer valuable insights and predictions for informed decision-making.
Trend Indicators:
- Moving Averages (MA): The 5-day moving average has been consistently above the short-term (10-day) simple moving average, indicating a short-term bullish trend.
- Exponential Moving Average (EMA): The EMA has shown a slight upward trend, suggesting a positive momentum in the stock price.
- Moving Average Convergence Divergence (MACD): The MACD line has been above the signal line, indicating a bullish signal.
- MACD Histogram: The histogram has been increasing, signaling strengthening bullish momentum.
Momentum Indicators:
- Relative Strength Index (RSI): The RSI has been fluctuating around the neutral zone, indicating indecision in the market.
- Stochastic Oscillator: Both %K and %D have been in the overbought zone, suggesting a potential reversal or consolidation.
- Williams %R (Willams %R): The Williams %R has been oscillating in the oversold and overbought regions, reflecting mixed sentiment.
Volatility Indicators:
- Bollinger Bands (BB): The stock price has been trading within the bands, with the upper band acting as resistance and the lower band as support.
- Bollinger Band Width (BBW): The BBW has been relatively stable, indicating consistent volatility levels.
Volume Indicators:
- On-Balance Volume (OBV): The OBV has shown mixed movements, suggesting uncertainty in the accumulation/distribution of the stock.
- Chaikin Money Flow (CMF): The CMF has been negative, indicating selling pressure in the market.
Key Observations and Opinions:
- Trend: The trend indicators suggest a short-term bullish bias in the stock price.
- Momentum: Momentum indicators show mixed signals, with potential for a reversal or consolidation.
- Volatility: Volatility has been relatively stable, with the stock price trading within the Bollinger Bands.
- Volume: Volume indicators reflect uncertainty in market participation and accumulation/distribution.
Conclusion:
Based on the analysis of the technical indicators, the next few days' possible stock price movement for RTH is likely to experience consolidation. The mixed signals from momentum indicators, coupled with stable volatility and uncertain volume movements, suggest a period of indecision in the market. Traders should exercise caution and wait for clearer signals before taking significant positions.