Technical Analysis of RUFF 2024-05-10
Overview:
In analyzing the technical indicators for RUFF stock over the last 5 days, we will delve into the trends, momentum, volatility, and volume indicators to provide a comprehensive outlook on the possible stock price movement in the coming days. By examining key metrics such as moving averages, MACD, RSI, Bollinger Bands, and OBV, we aim to offer valuable insights and predictions for informed decision-making.
Trend Indicators:
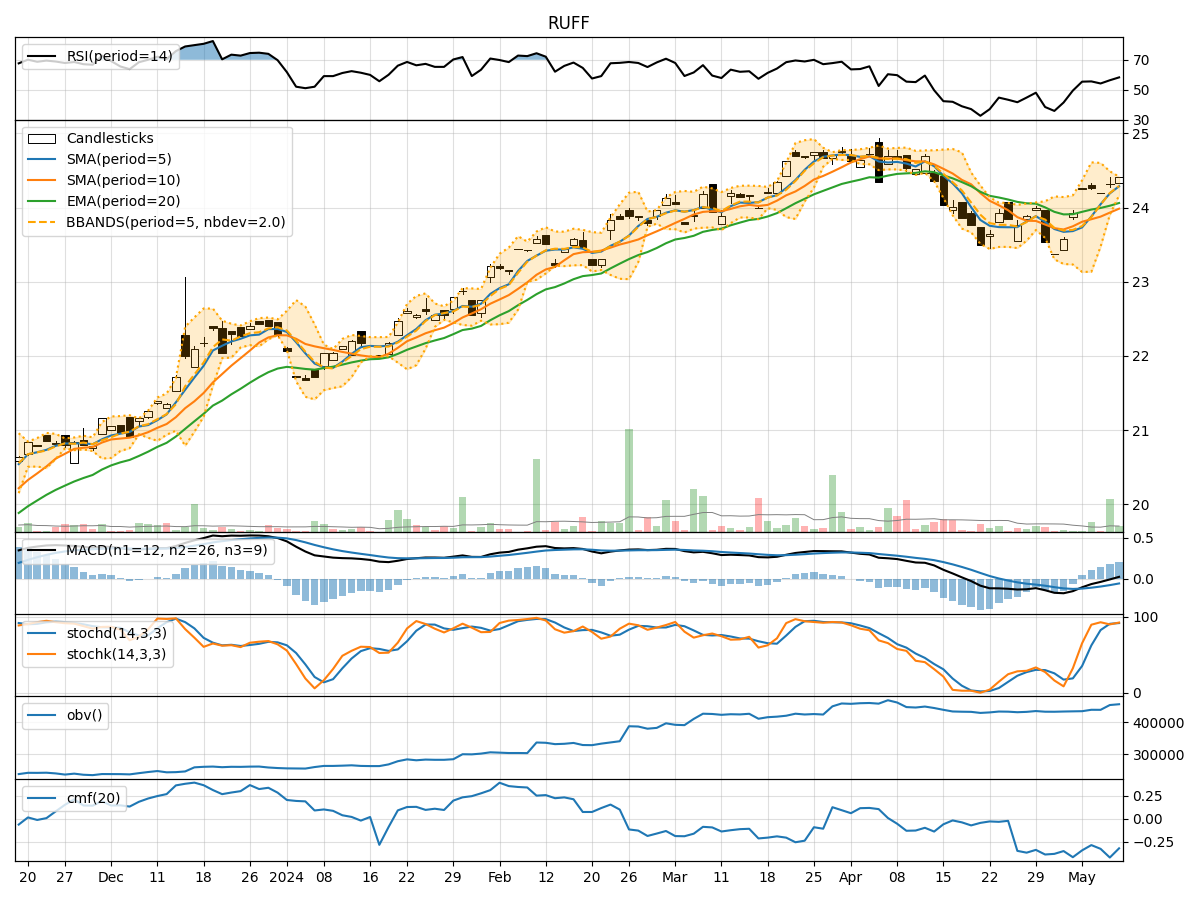
- Moving Averages (MA): The 5-day moving average has been trending above the simple moving average (SMA) of 10 days, indicating a short-term bullish trend.
- MACD: The MACD line has been consistently above the signal line, with both lines showing an upward trend, suggesting bullish momentum.
- EMA: The exponential moving average (EMA) over 20 days has been steadily increasing, supporting the bullish sentiment in the short to medium term.
Momentum Indicators:
- RSI: The Relative Strength Index (RSI) has been fluctuating around the 50 level, indicating a neutral momentum in the stock.
- Stochastic Oscillator: Both %K and %D lines of the stochastic oscillator have been in the overbought zone, suggesting a potential reversal or consolidation.
- Williams %R: The Williams %R is hovering around the oversold territory, signaling a possible buying opportunity.
Volatility Indicators:
- Bollinger Bands: The stock price has been trading within the Bollinger Bands, with the bands narrowing, indicating decreasing volatility and a potential breakout in the near future.
- Bollinger %B: The %B indicator is currently below 1, suggesting the stock is trading below the lower band, potentially indicating an oversold condition.
Volume Indicators:
- On-Balance Volume (OBV): The OBV indicator has been fluctuating, indicating a balance between buying and selling pressure.
- Chaikin Money Flow (CMF): The CMF over 20 days has been negative, indicating a bearish money flow in the stock.
Conclusion:
Based on the analysis of the technical indicators, the stock is currently exhibiting mixed signals. The trend indicators suggest a bullish sentiment in the short to medium term, supported by moving averages and MACD. However, momentum indicators like RSI and stochastic oscillator point towards a neutral to slightly bearish momentum. Volatility indicators indicate a potential decrease in volatility, possibly leading to a breakout.
Key Observations:
- Trend: Upward
- Momentum: Neutral to Slightly Bearish
- Volatility: Decreasing
- Volume: Balanced
Possible Stock Price Movement:
Considering the mixed signals from the technical indicators, the stock price may experience some consolidation or sideways movement in the coming days. Traders should closely monitor key levels such as support and resistance to identify potential entry and exit points. It is advisable to wait for clearer signals or confirmation from multiple indicators before taking significant trading positions.