Technical Analysis of RULE 2024-05-10
Overview:
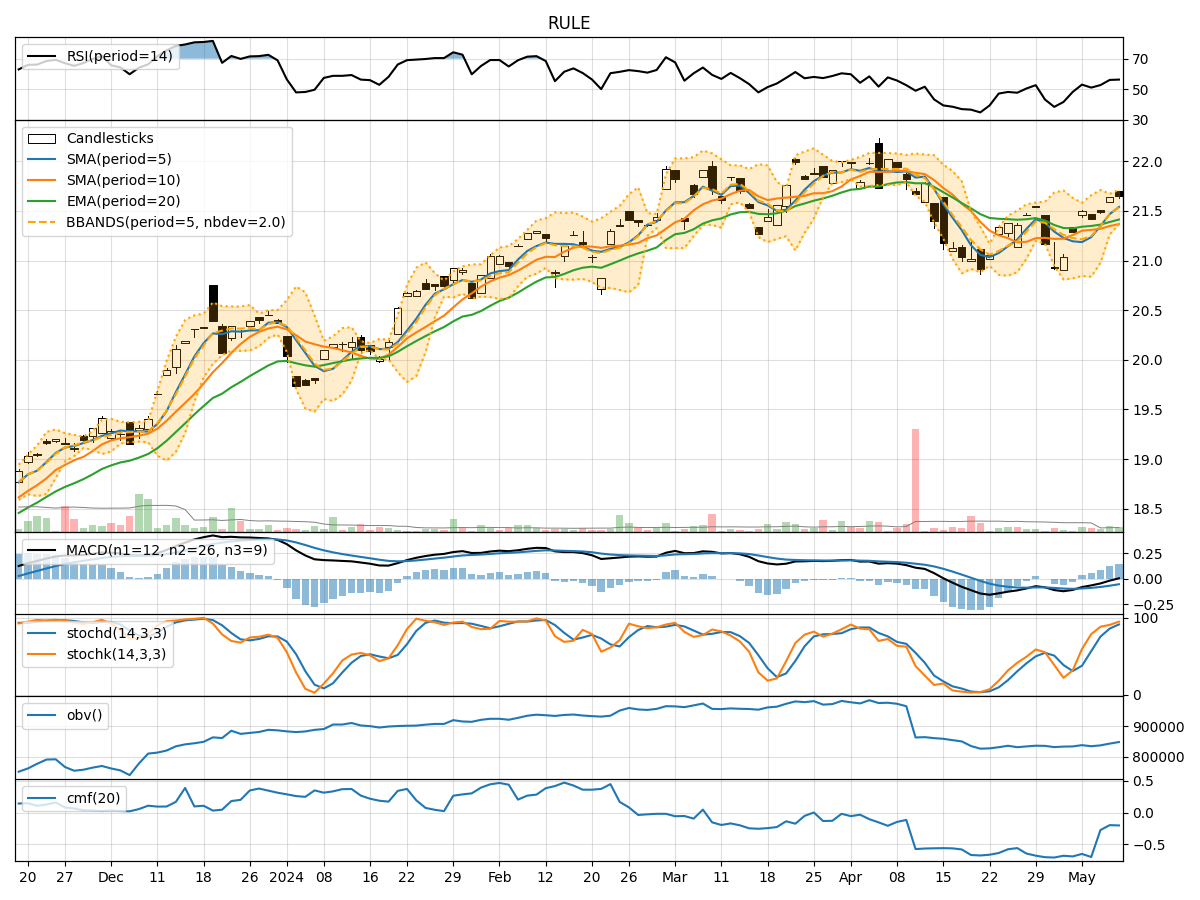
In the last 5 trading days, the stock has shown a mixed performance based on various technical indicators. The trend indicators suggest a slightly bullish sentiment, with the moving averages trending upwards. Momentum indicators show a strengthening momentum, while volatility indicators indicate a narrowing of the Bollinger Bands. Volume indicators show a mixed picture with a slight decrease in On-Balance Volume (OBV) and Chaikin Money Flow (CMF).
Trend Indicators:
- Moving Averages (MA): The 5-day MA is above the 10-day SMA, indicating a short-term bullish trend.
- Exponential Moving Average (EMA): The EMA is also trending upwards, supporting the bullish sentiment.
- Moving Average Convergence Divergence (MACD): The MACD line is positive, suggesting a bullish trend.
- Conclusion: Bullish sentiment based on trend indicators.
Momentum Indicators:
- Relative Strength Index (RSI): RSI is in the neutral zone, not indicating overbought or oversold conditions.
- Stochastic Oscillator: Both %K and %D are in the overbought territory, suggesting a potential reversal.
- Williams %R (WILLR): Williams %R is close to the oversold region, indicating a possible buying opportunity.
- Conclusion: Mixed momentum signals, with a potential for a reversal.
Volatility Indicators:
- Bollinger Bands (BB): The bands are narrowing, indicating decreasing volatility and a potential breakout.
- Conclusion: Consolidation in volatility, with a potential for a breakout.
Volume Indicators:
- On-Balance Volume (OBV): OBV has shown a slight decrease, suggesting some distribution.
- Chaikin Money Flow (CMF): CMF is negative, indicating selling pressure.
- Conclusion: Bearish volume signals, with a potential for further downside.
Overall Conclusion:
Based on the analysis of the technical indicators, the stock is likely to experience mixed price movements in the next few days. The trend indicators suggest a bullish sentiment, while momentum indicators show mixed signals with a potential for a reversal. Volatility is in a consolidation phase, indicating a potential breakout, and volume indicators point towards bearish pressure.
Considering the overall analysis, it is recommended to proceed with caution and closely monitor the price action for potential entry or exit points. Traders may consider waiting for more clarity in momentum and volume before taking significant positions. Exercise caution and consider a balanced approach in trading decisions.