Technical Analysis of RUNN 2024-05-10
Overview:
In analyzing the technical indicators for the stock of RUNN over the last 5 days, we will delve into the trends, momentum, volatility, and volume indicators to provide a comprehensive outlook on the possible future stock price movements. By examining these key indicators, we aim to offer valuable insights and recommendations for potential investors.
Trend Indicators:
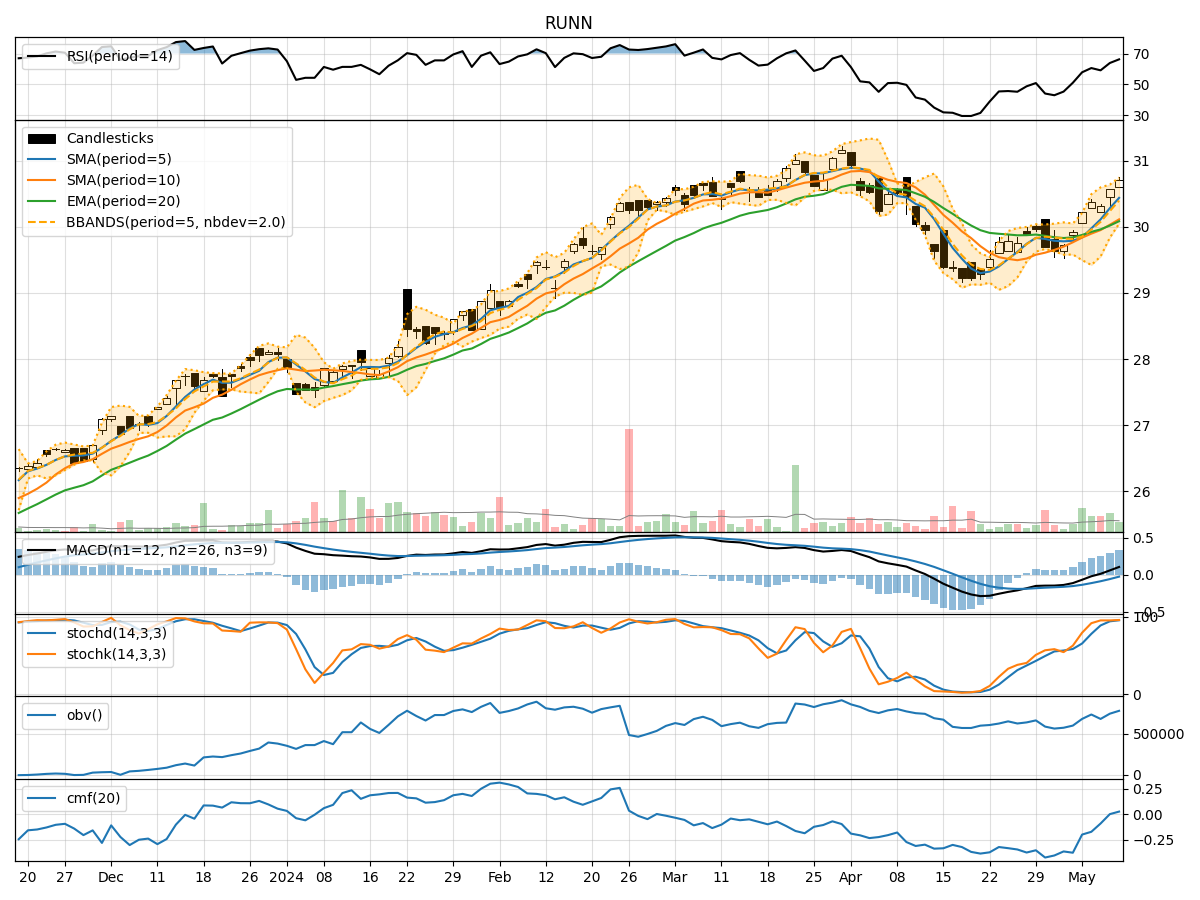
- Moving Averages (MA): The 5-day Moving Average (MA) has been consistently above the Simple Moving Average (SMA) and Exponential Moving Average (EMA), indicating a bullish trend.
- MACD: The MACD line has been consistently above the signal line, with both lines showing an upward trend, suggesting bullish momentum.
- RSI: The Relative Strength Index (RSI) has been fluctuating in the overbought territory, indicating strong buying pressure.
Momentum Indicators:
- Stochastic Oscillator: Both %K and %D lines of the Stochastic Oscillator have been in the overbought zone, suggesting a potential reversal or consolidation.
- Williams %R: The Williams %R has been hovering near the oversold territory, indicating a possible buying opportunity.
Volatility Indicators:
- Bollinger Bands (BB): The stock price has been trading within the Bollinger Bands, with the bands widening slightly, indicating increased volatility.
- Average True Range (ATR): The ATR has shown a moderate increase, suggesting a rise in price volatility.
Volume Indicators:
- On-Balance Volume (OBV): The OBV has been fluctuating, indicating indecision among investors regarding the stock.
- Chaikin Money Flow (CMF): The CMF has been negative, reflecting selling pressure in the stock.
Key Observations:
- The trend indicators suggest a strong bullish sentiment in the stock.
- Momentum indicators show signs of potential overbought conditions, indicating a need for caution.
- Volatility indicators point towards increasing price fluctuations.
- Volume indicators reflect mixed signals, with no clear direction in investor sentiment.
Conclusion:
Based on the analysis of the technical indicators, the stock of RUNN is currently in an upward trend with bullish momentum. However, the overbought conditions indicated by the momentum indicators and the increased volatility signal a potential consolidation phase or minor pullback in the near term. Investors should closely monitor the price action and key support levels for potential buying opportunities or profit-taking strategies.