Technical Analysis of RVRB 2024-05-10
Overview:
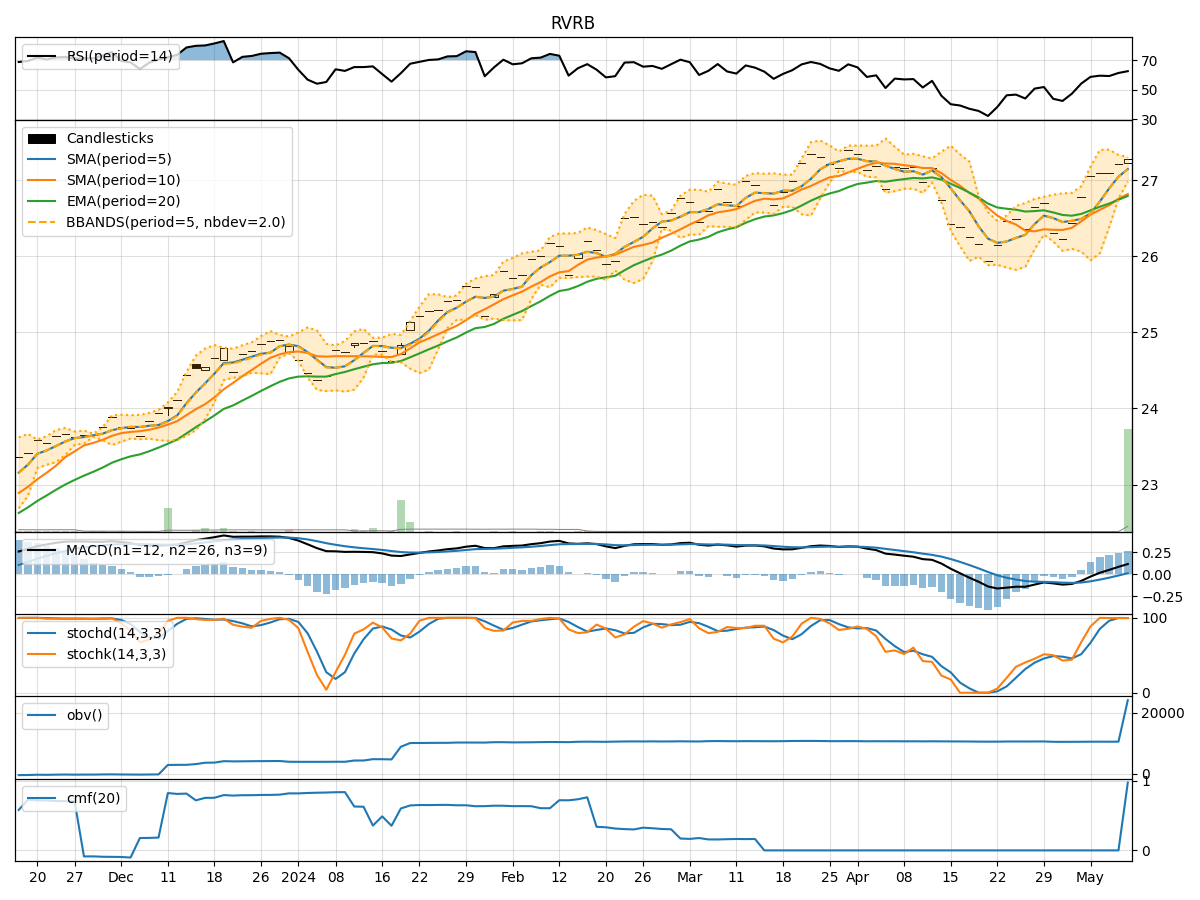
In analyzing the provided RVRB TA data for the last 5 days, we will delve into the technical indicators across trend, momentum, volatility, and volume to derive insights into the possible future stock price movement. By examining these indicators comprehensively, we aim to provide a well-informed prediction backed by data-driven analysis and expert interpretation.
Trend Analysis:
- Moving Averages (MA): The 5-day MA has been consistently above the closing prices, indicating an upward trend. This suggests a positive momentum in the stock's price movement.
- MACD: The MACD line has been consistently above the signal line, with both lines trending upwards. This signals a bullish momentum in the stock.
Momentum Analysis:
- RSI: The RSI has been gradually increasing and is currently in the overbought territory above 70, indicating a potential overvalued condition.
- Stochastic Oscillator: Both %K and %D have been consistently high, suggesting that the stock is in an overbought condition.
Volatility Analysis:
- Bollinger Bands (BB): The stock price has been consistently trading above the middle Bollinger Band, indicating an upward price movement. The bands are relatively narrow, suggesting low volatility.
Volume Analysis:
- On-Balance Volume (OBV): The OBV has shown a significant increase over the last 5 days, indicating strong buying pressure in the stock.
- Chaikin Money Flow (CMF): The CMF has been positive, indicating inflow of money into the stock over the analyzed period.
Key Observations:
- The stock is currently in an upward trend supported by moving averages and MACD.
- Momentum indicators like RSI and Stochastic suggest the stock is overbought and may experience a pullback.
- Volatility is relatively low, indicating a stable price movement.
- Strong buying pressure is evident from the OBV and CMF indicators.
Conclusion:
Based on the analysis of the technical indicators, the next few days' possible stock price movement is likely to be sideways to slightly bearish. While the trend remains bullish, the overbought conditions indicated by momentum indicators suggest a potential correction or consolidation in the stock price. Traders may consider taking profits or implementing risk management strategies in anticipation of a possible pullback. It is essential to monitor the price action closely and consider other fundamental factors before making any investment decisions.