Technical Analysis of RWJ 2024-05-10
Overview:
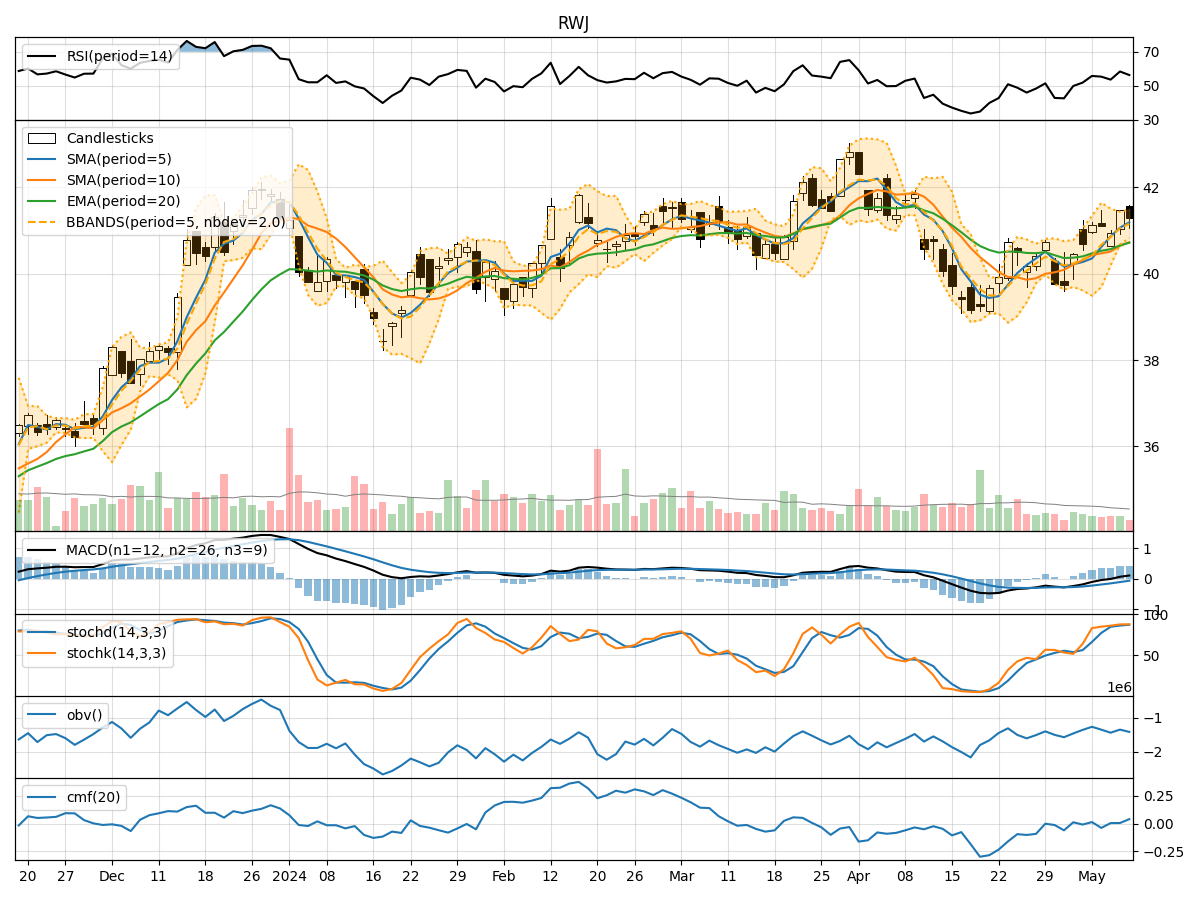
In the last 5 trading days, the stock has shown mixed movements with fluctuations in price and volume. The technical indicators provide insights into the trend, momentum, volatility, and volume of the stock. By analyzing these indicators, we can make informed predictions about the possible future stock price movements.
Trend Analysis:
- Moving Averages (MA): The 5-day Moving Average (MA) has been fluctuating around the Simple Moving Average (SMA) and Exponential Moving Average (EMA) values, indicating a lack of clear trend direction.
- MACD: The Moving Average Convergence Divergence (MACD) has been negative but showing signs of convergence towards the signal line, suggesting a potential reversal in the trend.
- MACD Histogram: The MACD Histogram has been decreasing but is starting to show signs of bottoming out, indicating a possible shift in momentum.
Momentum Analysis:
- RSI: The Relative Strength Index (RSI) has been fluctuating around the mid-level, indicating indecision in the market.
- Stochastic Oscillator: The Stochastic Oscillator is in the overbought region, suggesting a potential reversal or consolidation in the near term.
- Williams %R: The Williams %R is in the oversold region, indicating a possible buying opportunity.
Volatility Analysis:
- Bollinger Bands: The Bollinger Bands are narrowing, suggesting a decrease in volatility and a potential breakout or breakdown in the price.
- Bollinger %B: The Bollinger %B is below 1, indicating the price is below the lower band and potentially oversold.
Volume Analysis:
- On-Balance Volume (OBV): The OBV has been fluctuating, indicating mixed buying and selling pressure.
- Chaikin Money Flow (CMF): The CMF is positive, suggesting that money is flowing into the stock despite the fluctuations.
Conclusion:
Based on the analysis of the technical indicators: - The stock is currently in a sideways consolidation phase with mixed signals from the trend, momentum, volatility, and volume indicators. - The MACD and MACD Histogram are showing signs of a potential reversal in the trend. - The Stochastic Oscillator and Williams %R suggest a possible reversal or consolidation in the near term. - The Bollinger Bands narrowing indicates a potential breakout or breakdown in the price. - The OBV and CMF show mixed buying and selling pressure but with a slight positive bias.