Technical Analysis of RWL 2024-05-10
Overview:
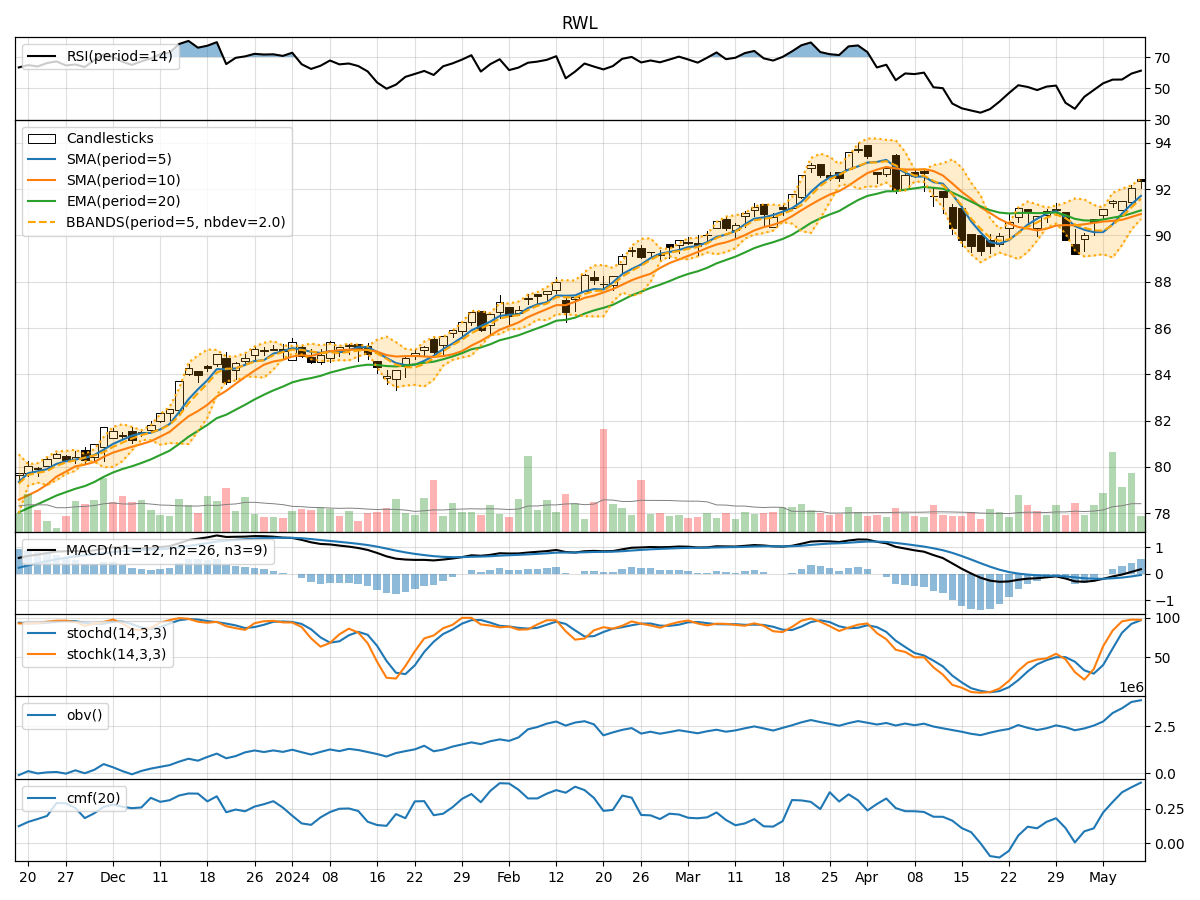
In the last 5 trading days, RWL stock has shown a consistent uptrend in both price and volume. The moving averages have been trending upwards, indicating a bullish sentiment. Momentum indicators like RSI and Stochastic oscillators suggest the stock is in overbought territory but still showing strength. Volatility indicators like Bollinger Bands show a narrowing range, potentially signaling a period of consolidation. Volume indicators like OBV and CMF confirm the buying pressure.
Trend Analysis:
- Moving averages (MA) have been steadily increasing, with the 5-day MA consistently above the 10-day SMA and 20-day EMA.
- MACD is positive and increasing, indicating bullish momentum.
- The stock price has been consistently above the moving averages, showing strength in the trend.
Momentum Analysis:
- RSI is in the overbought zone but has room to go higher before reaching extreme levels.
- Stochastic indicators are in the overbought region, suggesting a potential pullback or consolidation.
- Williams %R is also in the oversold territory, indicating a possible reversal.
Volatility Analysis:
- Bollinger Bands are narrowing, indicating reduced volatility and a potential upcoming breakout.
- The stock price has been trading within the bands, suggesting a period of consolidation.
- Bollinger Band %B is above 0.5, indicating an uptrend but not in an overbought condition.
Volume Analysis:
- On-Balance Volume (OBV) has been consistently increasing, confirming the uptrend.
- Chaikin Money Flow (CMF) is positive, indicating strong buying pressure in the stock.
Conclusion:
Based on the technical indicators and analysis: - Trend: The stock is in a strong uptrend, supported by moving averages and MACD. - Momentum: While momentum indicators suggest overbought conditions, the trend is still intact. - Volatility: The narrowing Bollinger Bands indicate a potential breakout or continuation of the current consolidation phase. - Volume: Strong buying pressure is confirmed by increasing OBV and positive CMF.
Overall View:
Considering the overall technical analysis, the stock is likely to continue its upward movement in the short term. However, given the overbought signals in momentum indicators, there might be a temporary pullback or consolidation before the uptrend resumes. Investors should watch for a breakout from the Bollinger Bands as a potential signal for the next price movement.
Recommendation:
- Short Term: Expect a potential pullback or consolidation before the uptrend resumes.
- Long Term: The overall trend remains bullish, so consider holding or accumulating on dips for long-term gains.
Key Conclusion:
The stock is in a bullish trend with a potential for a short-term consolidation or pullback before resuming its upward movement.