Technical Analysis of RWX 2024-05-10
Overview:
In analyzing the technical indicators for RWX over the last 5 days, we will delve into the trend, momentum, volatility, and volume indicators to provide a comprehensive outlook on the possible stock price movement. By examining these key factors, we aim to offer valuable insights and predictions for the upcoming trading days.
Trend Indicators:
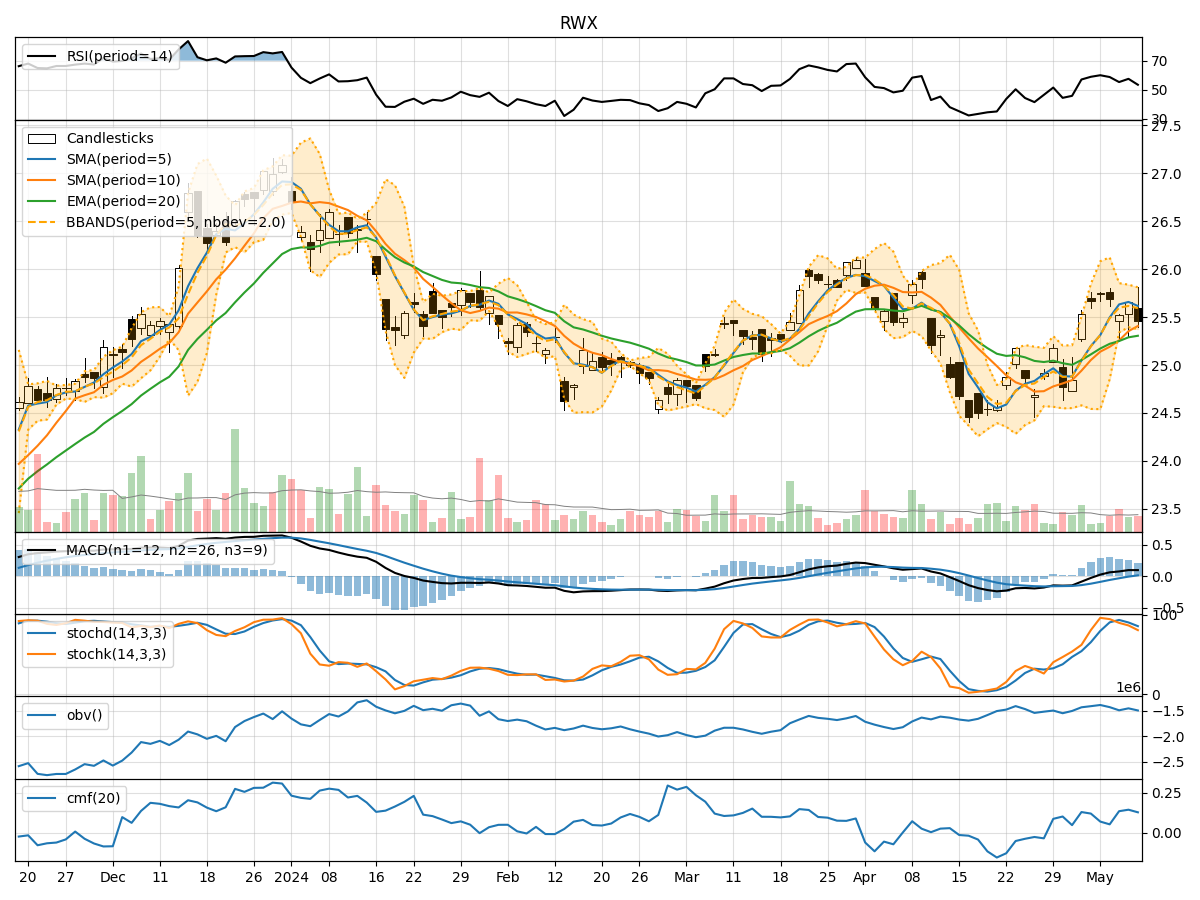
- Moving Averages (MA): The 5-day Moving Average (MA) has been consistently above the Simple Moving Average (SMA) and Exponential Moving Average (EMA), indicating a bullish trend.
- MACD: The MACD line has been above the signal line, with both lines showing an upward trend, suggesting bullish momentum.
- MACD Histogram: The MACD Histogram has been increasing over the past few days, indicating strengthening bullish momentum.
Momentum Indicators:
- RSI: The Relative Strength Index (RSI) has been fluctuating around the 50 level, indicating a neutral momentum.
- Stochastic Oscillator: Both %K and %D lines of the Stochastic Oscillator have been declining, suggesting a potential reversal in momentum.
- Williams %R: The Williams %R is in oversold territory, indicating a possible bullish reversal.
Volatility Indicators:
- Bollinger Bands: The stock price has been trading within the Bollinger Bands, with the bands narrowing, indicating decreasing volatility.
- Bollinger %B: The %B indicator is hovering around the middle range, suggesting a neutral stance in terms of volatility.
Volume Indicators:
- On-Balance Volume (OBV): The OBV has been fluctuating, indicating mixed buying and selling pressure.
- Chaikin Money Flow (CMF): The CMF has been positive, suggesting accumulation in the stock.
Key Observations:
- The trend indicators suggest a bullish sentiment, with moving averages and MACD signaling upward momentum.
- Momentum indicators show a mixed picture, with RSI neutral, Stochastic indicating a potential reversal, and Williams %R in oversold territory.
- Volatility indicators point towards decreasing volatility, potentially leading to a consolidation phase.
- Volume indicators reflect mixed activity, with OBV fluctuating and CMF showing accumulation.
Conclusion:
Based on the analysis of the technical indicators, the next few days for RWX could see sideways movement with a slight bullish bias. Traders should monitor the Stochastic Oscillator for a potential reversal in momentum and keep an eye on the Bollinger Bands for any breakout signals. Overall, a cautious approach with a focus on key support and resistance levels is recommended in the upcoming trading sessions.