Technical Analysis of RXL 2024-05-10
Overview:
In analyzing the technical indicators for RXL over the last 5 days, we will delve into the trend, momentum, volatility, and volume indicators to provide a comprehensive outlook on the possible stock price movement in the coming days.
Trend Analysis:
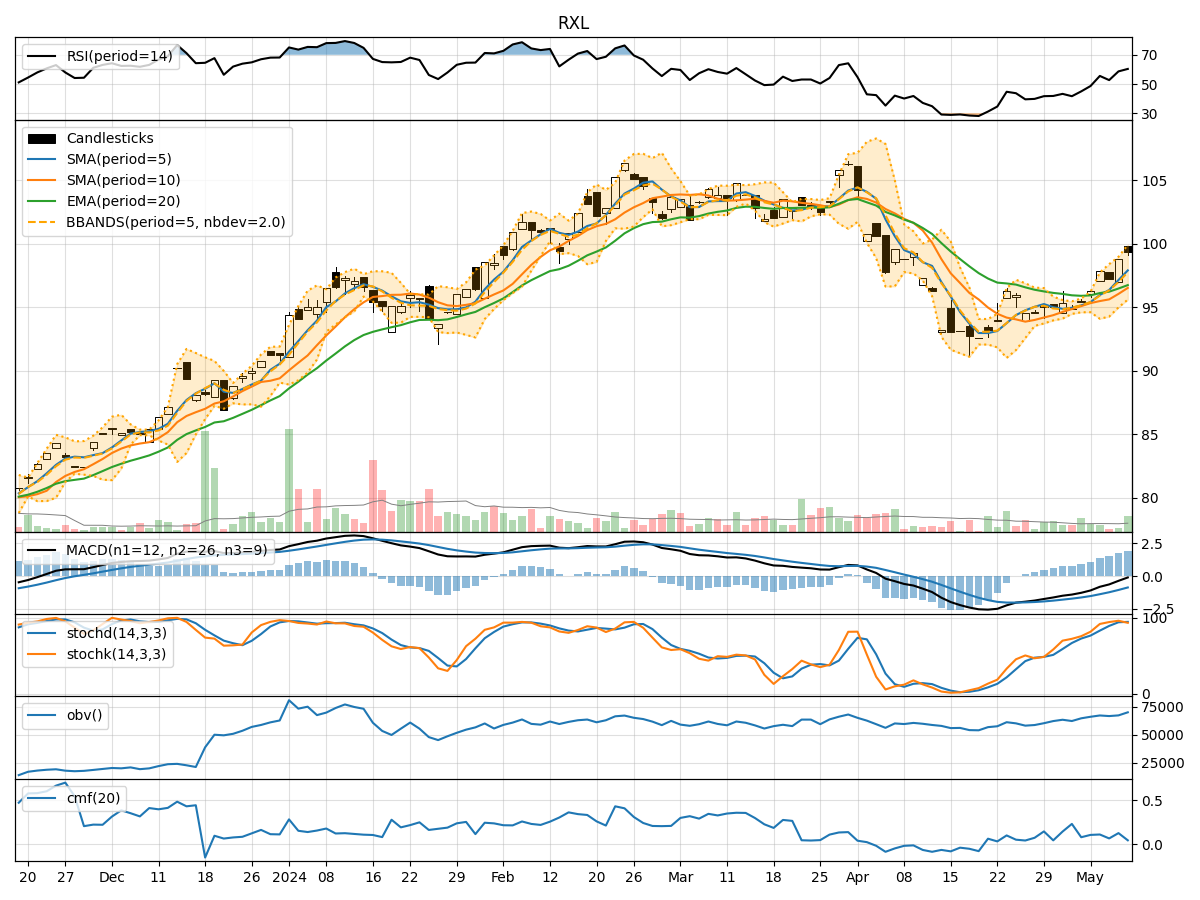
- Moving Averages (MA): The 5-day Moving Average (MA) has been consistently above the Simple Moving Average (SMA) and Exponential Moving Average (EMA), indicating a bullish trend.
- MACD: The MACD line has been consistently above the signal line, suggesting bullish momentum.
- RSI: The Relative Strength Index (RSI) has been fluctuating around the neutral zone, indicating a balanced market sentiment.
Momentum Analysis:
- Stochastic Oscillator: The Stochastic Oscillator has been in the overbought region, suggesting a potential reversal or consolidation.
- Williams %R: The Williams %R indicator has shown mixed signals, hovering around the oversold region.
Volatility Analysis:
- Bollinger Bands: The Bollinger Bands have been widening, indicating increased volatility in the stock price.
- Bollinger %B: The %B indicator has been fluctuating within the bands, reflecting uncertainty in price direction.
Volume Analysis:
- On-Balance Volume (OBV): The OBV has shown a positive trend, indicating accumulation by investors.
- Chaikin Money Flow (CMF): The CMF has been positive, suggesting buying pressure in the stock.
Key Observations:
- The trend indicators suggest a bullish sentiment in the short term.
- Momentum indicators show signs of potential reversal or consolidation.
- Volatility indicators point towards increased price fluctuations.
- Volume indicators indicate positive accumulation and buying pressure.
Conclusion:
Based on the analysis of the technical indicators, the next few days' possible stock price movement for RXL is likely to be bullish in the short term. However, caution is advised as momentum indicators hint at a possible reversal or consolidation. Traders should closely monitor the Stochastic Oscillator and Williams %R for potential signals of a shift in momentum. Additionally, the widening Bollinger Bands indicate higher volatility, necessitating risk management strategies. Overall, a cautiously bullish stance is recommended, with a keen eye on key support and resistance levels for timely decision-making.