Technical Analysis of RYLD 2024-05-10
Overview:
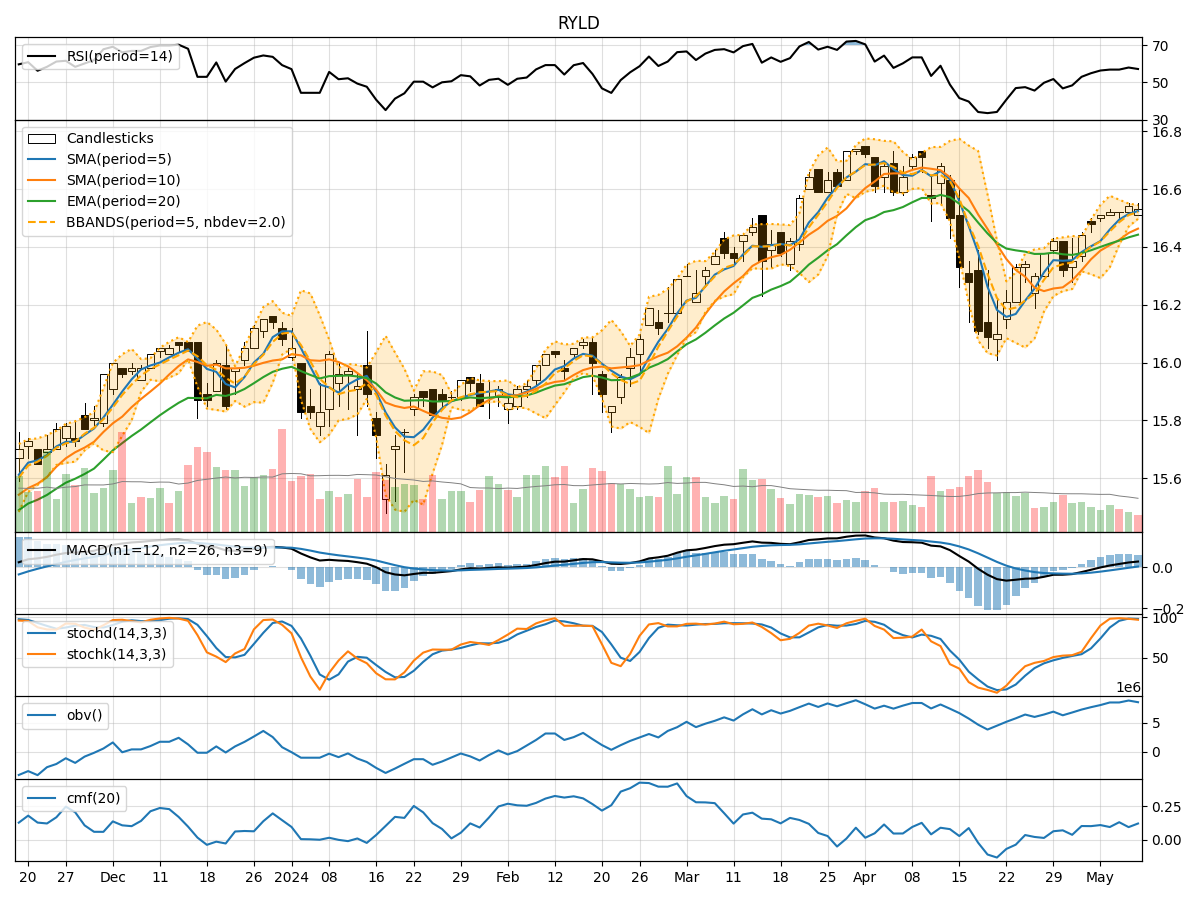
In the last 5 trading days, RYLD has shown a relatively stable price movement with minor fluctuations. The trend indicators suggest a slight uptrend, supported by the moving averages and MACD. Momentum indicators indicate a neutral to slightly positive momentum, with RSI hovering around the mid-level. Volatility indicators show a narrowing Bollinger Bands, indicating decreasing volatility. Volume indicators suggest a mixed sentiment with OBV showing some accumulation and CMF indicating a neutral sentiment.
Trend Indicators:
- Moving Averages (MA): The 5-day MA has been consistently above the 10-day SMA, indicating a short-term uptrend.
- MACD: The MACD line has been above the signal line, suggesting a bullish momentum.
Key Observation: The trend indicators point towards a slight bullish bias in the short term.
Momentum Indicators:
- RSI: RSI has been fluctuating around the neutral 50 level, indicating a balanced momentum.
- Stochastic Oscillator: Stochastics have been in the overbought territory, suggesting a potential reversal.
Key Observation: Momentum indicators suggest a neutral to slightly positive momentum in the near future.
Volatility Indicators:
- Bollinger Bands (BB): The narrowing of the Bollinger Bands indicates decreasing volatility.
Key Observation: Volatility is decreasing, which could lead to a consolidation phase in the stock price.
Volume Indicators:
- On-Balance Volume (OBV): OBV has shown some accumulation, indicating buying pressure.
- Chaikin Money Flow (CMF): CMF is neutral, suggesting a balanced flow of money into and out of the stock.
Key Observation: Volume indicators show a mixed sentiment with a slight bias towards accumulation.
Conclusion:
Based on the analysis of the technical indicators, the next few days for RYLD could see a sideways movement with a slight bullish bias. The trend indicators support a potential uptrend, while momentum indicators suggest a neutral to slightly positive momentum. Decreasing volatility indicates a possible consolidation phase, and volume indicators show a mixed sentiment with some accumulation.
Overall, the stock is likely to trade within a range with a potential for a modest upside. Traders may consider monitoring key support and resistance levels for potential entry and exit points.