Technical Analysis of RYLG 2024-05-10
Overview:
In analyzing the technical indicators for RYLG over the last 5 days, we will delve into the trend, momentum, volatility, and volume indicators to provide a comprehensive outlook on the possible stock price movement in the coming days. By examining these key indicators, we aim to offer valuable insights and predictions for potential investors.
Trend Analysis:
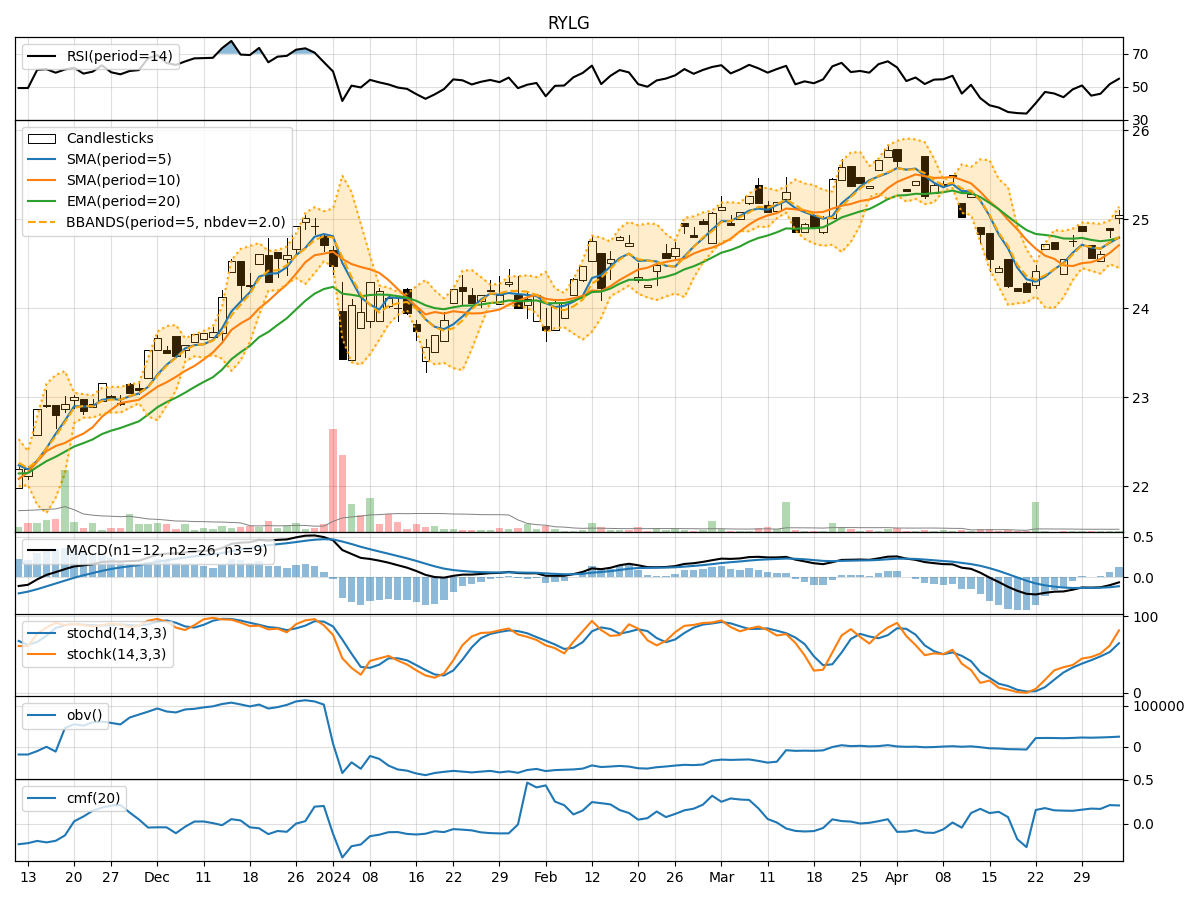
- Moving Averages (MA): The 5-day MA has been consistently above the closing price, indicating a bullish trend.
- MACD: The MACD line has been consistently above the signal line, suggesting a bullish momentum.
- Relative Strength Index (RSI): RSI has been fluctuating around the overbought territory, indicating strong buying pressure.
Momentum Analysis:
- Stochastic Oscillator: Both %K and %D have been in the overbought zone, signaling a potential reversal.
- Williams %R (WillR): Williams %R has been consistently in the oversold territory, indicating a possible buying opportunity.
Volatility Analysis:
- Bollinger Bands (BB): The stock price has been trading within the bands, suggesting a period of consolidation.
- Bollinger Band Width (BBW): The narrowing of the bands indicates decreasing volatility.
Volume Analysis:
- On-Balance Volume (OBV): The OBV has been relatively stable, indicating a balance between buying and selling pressure.
- Chaikin Money Flow (CMF): The CMF has been positive, suggesting a bullish money flow into the stock.
Conclusion:
Based on the analysis of the technical indicators, the stock RYLG is currently exhibiting a bullish trend with strong momentum and positive money flow. However, the overbought conditions in the stochastic oscillator and RSI suggest a potential short-term correction or consolidation. The narrowing Bollinger Bands also indicate decreased volatility and a possible period of sideways movement.
Forecast:
In the next few days, we can expect the stock price of RYLG to experience a short-term correction or consolidation before potentially resuming its upward trend. Investors should monitor the stochastic oscillator and RSI for signs of a reversal, while also keeping an eye on the OBV and CMF for any shifts in buying or selling pressure. Overall, a cautious approach with a focus on risk management is advisable in the current market environment.