Technical Analysis of RZG 2024-05-10
Overview:
In analyzing the technical indicators for RZG stock over the last 5 days, we will delve into the trend, momentum, volatility, and volume indicators to provide a comprehensive outlook on the possible stock price movement in the coming days. By examining these key indicators, we aim to offer valuable insights and predictions for potential investors.
Trend Analysis:
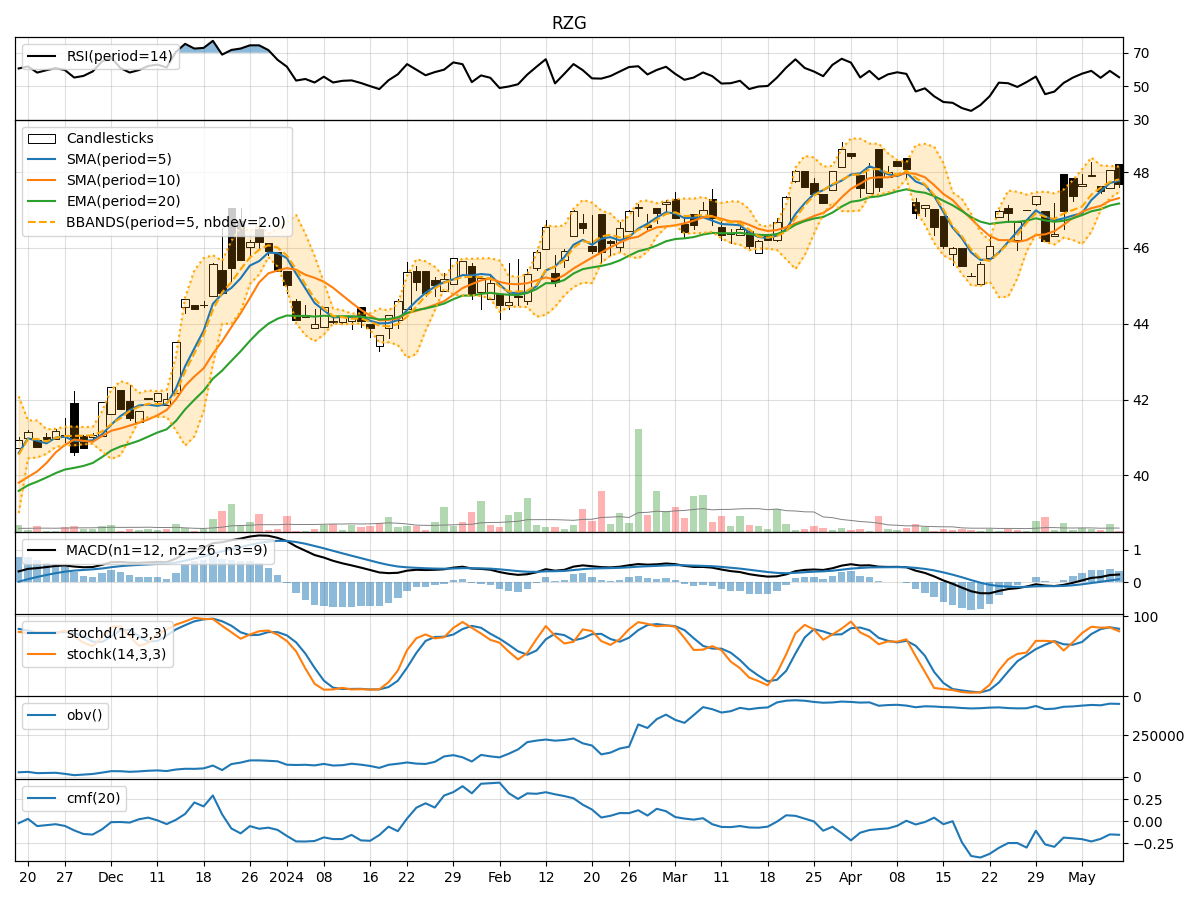
- Moving Averages (MA): The 5-day MA has been consistently above the closing prices, indicating a short-term uptrend.
- MACD: The MACD line has been above the signal line, suggesting bullish momentum.
- RSI: The RSI values have been fluctuating around the overbought territory, indicating strong buying pressure.
Key Observation: The trend indicators suggest a bullish sentiment in the short term.
Momentum Analysis:
- Stochastic Oscillator: Both %K and %D values have been relatively high, signaling strong upward momentum.
- Williams %R: The values have been in the oversold region, indicating potential buying opportunities.
Key Observation: Momentum indicators support the continuation of the bullish trend.
Volatility Analysis:
- Bollinger Bands (BB): The stock price has been trading within the bands, with the %B indicator showing a slight deviation from the upper band.
- Average True Range (ATR): The ATR values have been relatively stable, suggesting consistent price movements.
Key Observation: Volatility remains moderate, with no significant spikes or drops.
Volume Analysis:
- On-Balance Volume (OBV): The OBV values have been fluctuating, indicating mixed buying and selling pressure.
- Chaikin Money Flow (CMF): The CMF values have been negative, suggesting outflow of money from the stock.
Key Observation: Volume indicators show a lack of strong accumulation or distribution signals.
Conclusion:
Based on the analysis of the technical indicators, the stock is likely to continue its upward trend in the next few days. The bullish trend supported by moving averages, MACD, and RSI, coupled with strong momentum indicated by stochastic oscillators, points towards further price appreciation. While volatility remains stable, the volume indicators suggest a neutral stance with no clear accumulation or distribution signals.
Key Conclusion: Bullish sentiment is expected to persist in the short term for RZG stock. Investors may consider maintaining or initiating long positions based on the current technical outlook.
Remember, market conditions can change rapidly, so it's essential to monitor the indicators regularly for any shifts in trend or momentum.