Technical Analysis of RZV 2024-05-10
Overview:
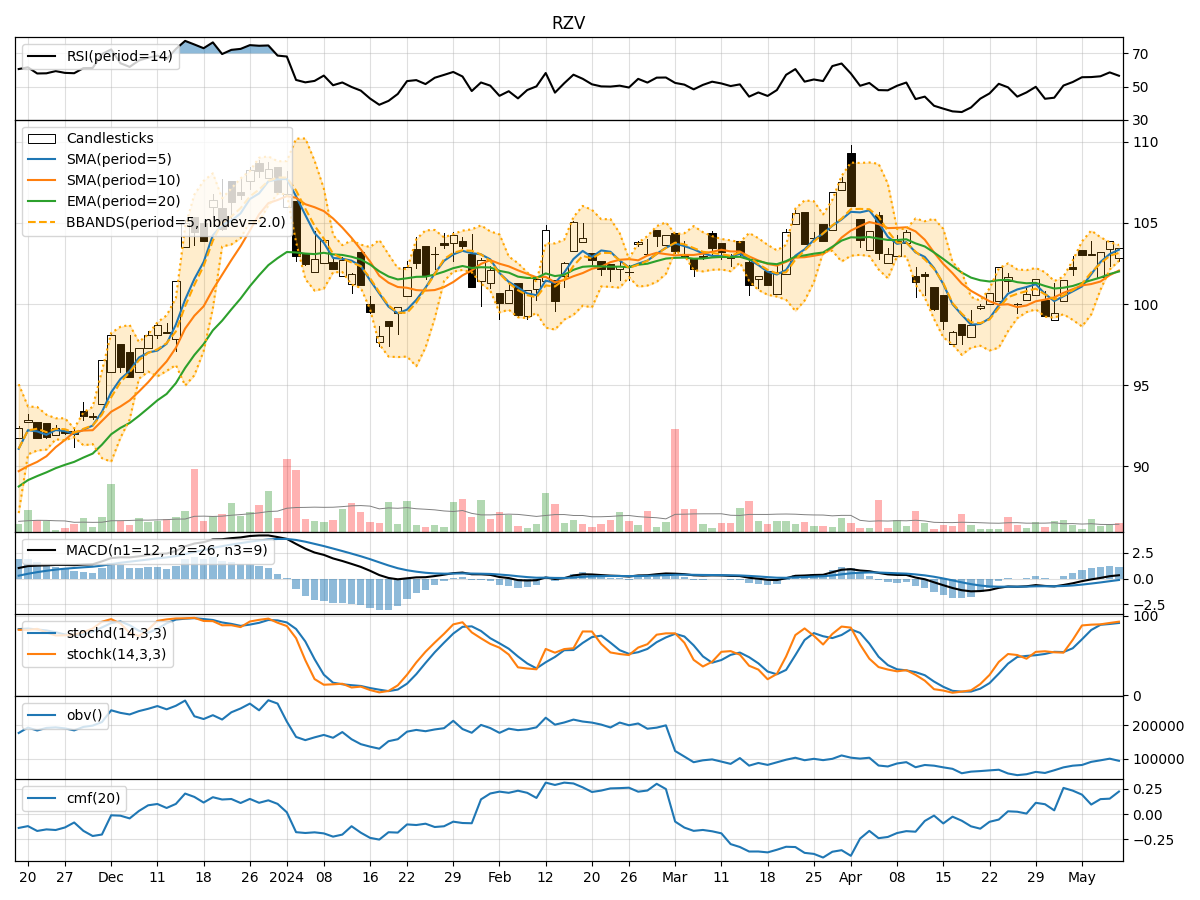
In analyzing the technical indicators for RZV over the last 5 days, we will delve into the trend, momentum, volatility, and volume indicators to provide a comprehensive outlook on the possible stock price movement. By examining these key factors, we aim to offer valuable insights and predictions for the upcoming days.
Trend Analysis:
- Moving Averages (MA): The 5-day Moving Average has been consistently rising, indicating a bullish trend in the short term.
- MACD: The MACD line has been above the signal line, suggesting positive momentum in the stock price.
- EMA: The Exponential Moving Average has been trending upwards, supporting the bullish sentiment in the market.
Key Observation: The trend indicators point towards a bullish outlook for RZV.
Momentum Analysis:
- RSI: The Relative Strength Index has been fluctuating around the neutral zone, indicating a balanced momentum.
- Stochastic Oscillator: Both %K and %D have been in the overbought territory, suggesting a potential reversal in the short term.
- Williams %R: The indicator has been hovering in the oversold region, signaling a possible buying opportunity.
Key Observation: The momentum indicators reflect a mixed sentiment with a slight bearish bias.
Volatility Analysis:
- Bollinger Bands: The bands have been narrowing, indicating decreasing volatility in the stock price.
- Bollinger %B: The %B indicator has been below 1, suggesting the stock is trading below the lower band.
- Average True Range (ATR): The ATR has been decreasing, indicating lower price volatility.
Key Observation: Volatility indicators signal a consolidation phase with a sideways movement.
Volume Analysis:
- On-Balance Volume (OBV): The OBV has been declining, indicating a decrease in buying pressure.
- Chaikin Money Flow (CMF): The CMF has been positive, suggesting money flow into the stock over the past 20 days.
Key Observation: Volume indicators suggest a weakening buying pressure.
Conclusion:
Based on the analysis of trend, momentum, volatility, and volume indicators, the next few days for RZV are likely to see a sideways movement with a slight bearish bias. Traders should exercise caution and consider potential reversals indicated by the momentum oscillators. The stock is expected to consolidate within a narrow range, with limited volatility. It is advisable to closely monitor key support and resistance levels for potential breakout opportunities.
Key Conclusion:
The overall outlook for RZV in the next few days is neutral to slightly bearish, with a potential for a sideways consolidation pattern. Investors should remain vigilant and adapt their strategies accordingly to navigate the current market conditions.