Technical Analysis of SAA 2024-05-10
Overview:
In analyzing the technical indicators for SAA stock over the last 5 days, we will delve into the trend, momentum, volatility, and volume indicators to provide a comprehensive outlook on the possible stock price movement in the coming days. By examining these key aspects, we aim to offer valuable insights and predictions for informed decision-making.
Trend Analysis:
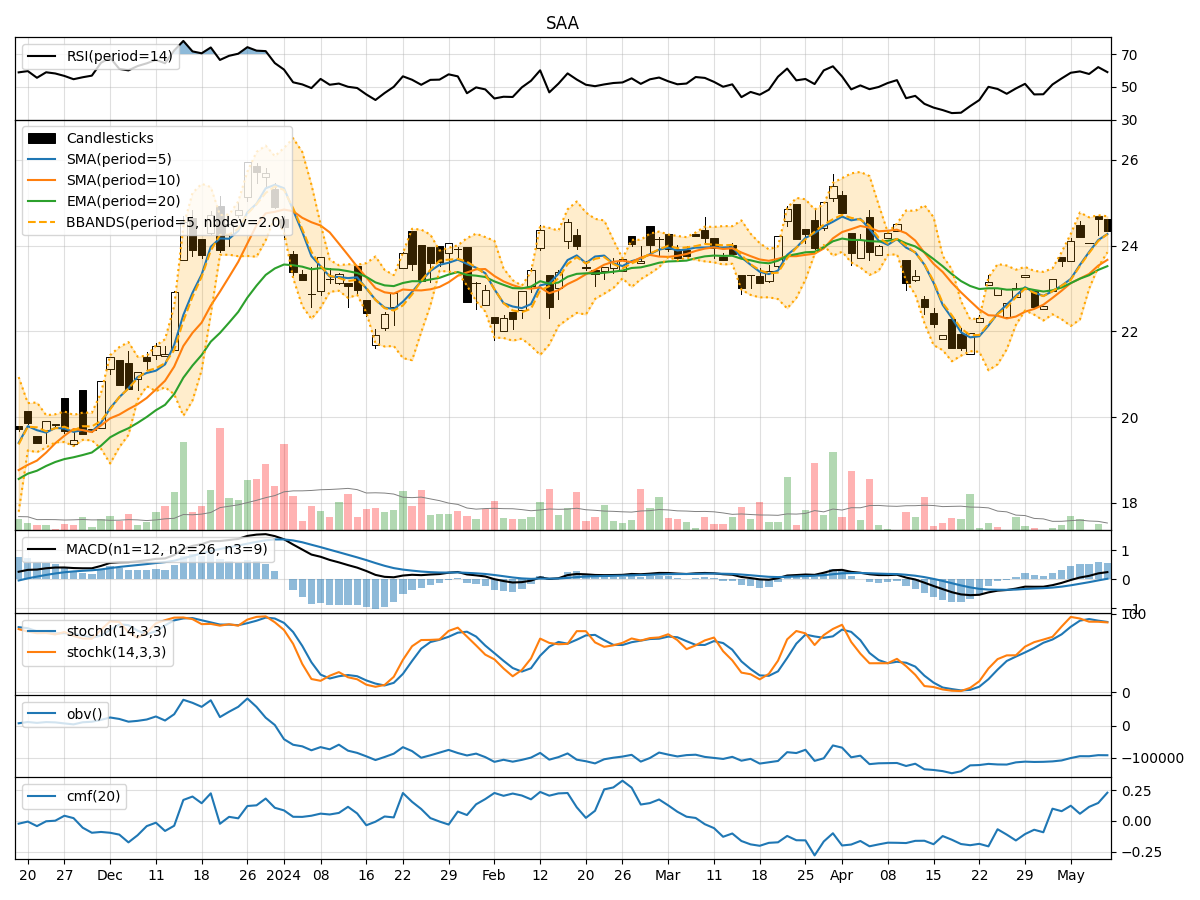
- Moving Averages (MA): The 5-day Moving Average (MA) has been consistently above the Simple Moving Average (SMA) and Exponential Moving Average (EMA), indicating a bullish trend.
- MACD: The MACD line has been consistently above the signal line, suggesting a bullish momentum in the stock price.
- MACD Histogram: The MACD Histogram has shown positive values, further supporting the bullish trend.
Momentum Analysis:
- RSI: The Relative Strength Index (RSI) has been fluctuating around the 60-70 range, indicating a neutral momentum in the stock.
- Stochastic Oscillator: Both %K and %D lines of the Stochastic Oscillator have been hovering around the overbought zone, suggesting a potential reversal in the stock price.
- Williams %R: The Williams %R indicator has been oscillating in the oversold and overbought regions, reflecting mixed momentum.
Volatility Analysis:
- Bollinger Bands: The Bollinger Bands have shown narrowing volatility, with the stock price trading within the bands, indicating a period of consolidation.
- Bollinger %B: The %B indicator has been fluctuating around the midline, further confirming the consolidation phase.
Volume Analysis:
- On-Balance Volume (OBV): The OBV indicator has shown mixed volume accumulation, reflecting indecision among market participants.
- Chaikin Money Flow (CMF): The CMF indicator has been positive, suggesting some buying pressure in the stock.
Key Observations:
- The trend indicators point towards a bullish sentiment in the stock price.
- Momentum indicators show a neutral to slightly bearish outlook due to potential overbought conditions.
- Volatility indicators indicate a consolidation phase in the stock price.
- Volume indicators reflect mixed participation from investors.
Conclusion:
Based on the analysis of the technical indicators, the next few days' possible stock price movement for SAA is likely to experience sideways consolidation with a slight bearish bias in momentum. Traders should exercise caution and closely monitor key support and resistance levels for potential entry or exit points.