Technical Analysis of SAEF 2024-05-10
Overview:
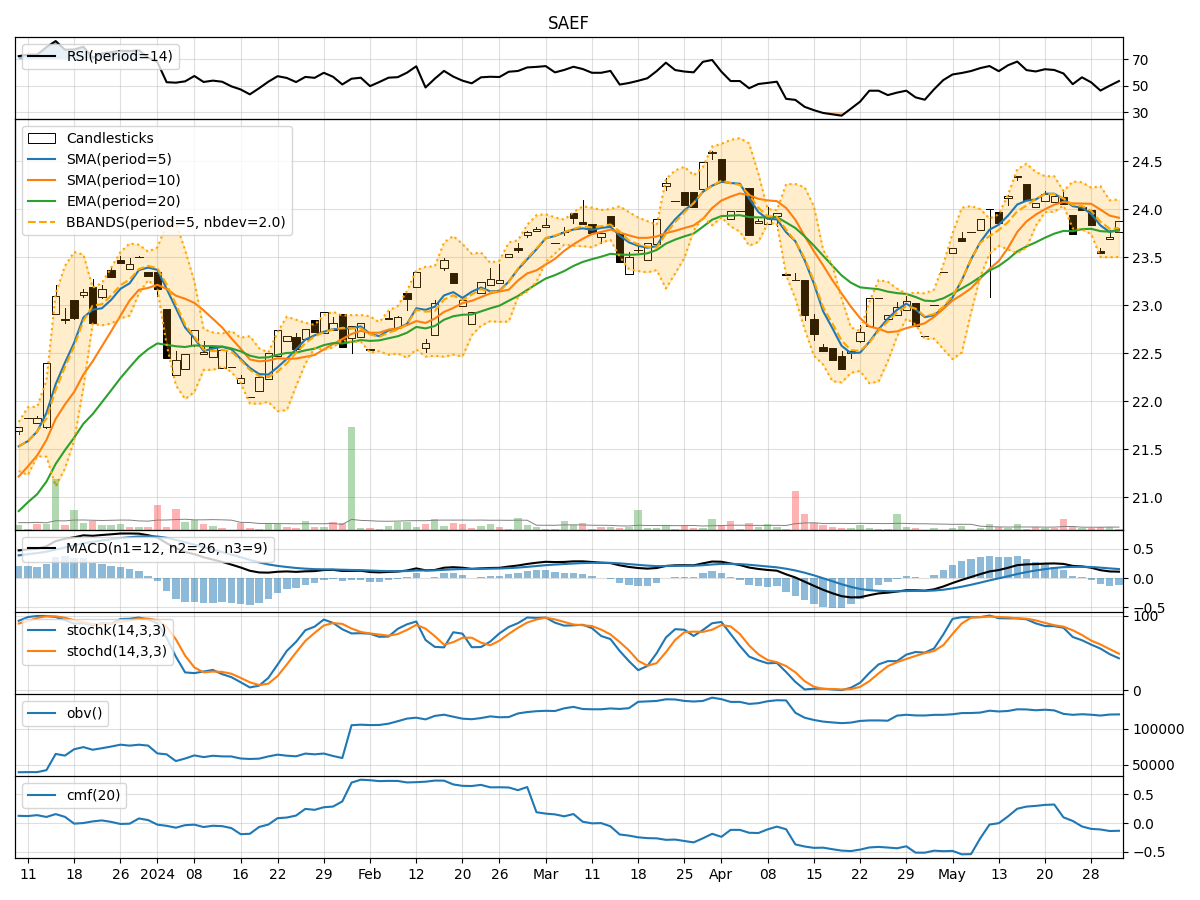
In analyzing the technical indicators for SAEF stock over the last 5 days, we will delve into the trends, momentum, volatility, and volume aspects to provide a comprehensive outlook on the possible stock price movement in the upcoming days. By examining key indicators such as moving averages, MACD, RSI, Bollinger Bands, and OBV, we aim to offer valuable insights and predictions for informed decision-making.
Trend Analysis:
- Moving Averages (MA): The 5-day MA has been consistently above the closing prices, indicating a bullish trend.
- MACD: The MACD line has been above the signal line, suggesting a bullish momentum.
- EMA: The EMA has been trending upwards, supporting the bullish sentiment.
Momentum Analysis:
- RSI: The RSI has been increasing, showing strengthening momentum.
- Stochastic Oscillator: Both %K and %D have been in the overbought zone, signaling a potential reversal.
- Williams %R: The indicator has been consistently at or near oversold levels, indicating a possible buying opportunity.
Volatility Analysis:
- Bollinger Bands: The stock price has been trading within the bands, suggesting a period of consolidation.
- Bollinger %B: The %B indicator has been hovering around 0.8, indicating a relatively high price compared to recent values.
Volume Analysis:
- On-Balance Volume (OBV): The OBV has been increasing, reflecting accumulation by investors.
- Chaikin Money Flow (CMF): The CMF has been negative, indicating selling pressure in the market.
Conclusion:
Based on the analysis of the technical indicators, the stock is currently exhibiting bullish tendencies in terms of trend and momentum. However, the overbought levels in the stochastic oscillator and the negative CMF signal caution against a potential short-term correction or consolidation. The stock price may experience some volatility in the upcoming days as it navigates through these levels.
Considering the overall picture, it is likely that the stock will continue its upward trajectory in the medium to long term, but a pullback or sideways movement in the short term cannot be ruled out. Investors should closely monitor the stochastic oscillator and CMF for potential reversal signals and adjust their positions accordingly.
In conclusion, while the stock shows promise for further gains, a cautious approach with proper risk management is advisable in the current market environment.