Technical Analysis of SAGP 2024-05-10
Overview:
In analyzing the technical indicators for SAGP over the last 5 days, we will delve into the trend, momentum, volatility, and volume indicators to provide a comprehensive outlook on the possible stock price movement. By examining these key aspects, we aim to offer valuable insights and predictions for the upcoming days.
Trend Analysis:
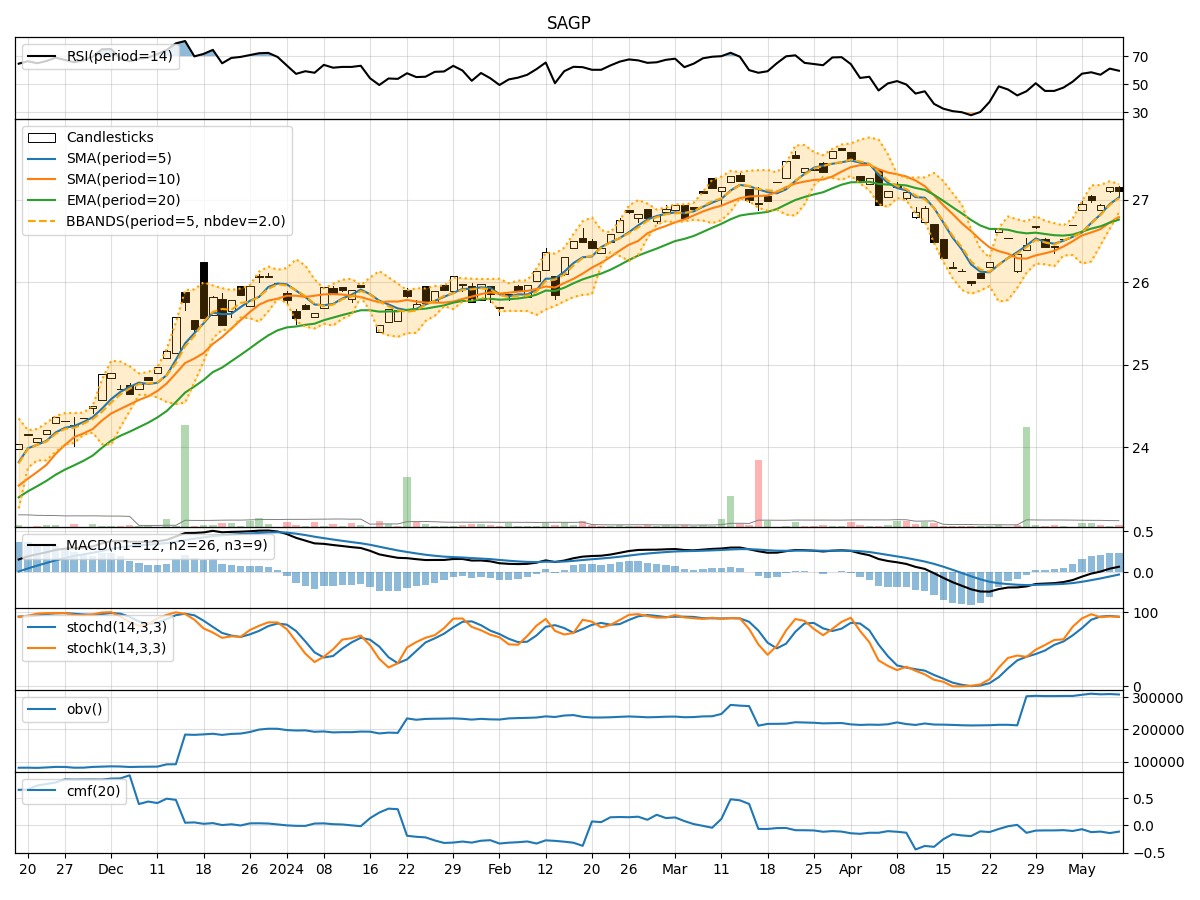
- Moving Averages (MA): The 5-day Moving Average (MA) has been consistently above the Simple Moving Average (SMA) and Exponential Moving Average (EMA), indicating a bullish trend.
- MACD: The MACD line has been consistently above the signal line, suggesting a bullish momentum in the stock price.
- RSI: The Relative Strength Index (RSI) has been fluctuating around the 60-70 range, indicating a neutral to slightly bullish sentiment.
Momentum Analysis:
- Stochastic Oscillator: The Stochastic Oscillator has been hovering in the overbought territory, suggesting a potential reversal or consolidation in the stock price.
- Williams %R: The Williams %R indicator has shown mixed signals, moving between overbought and oversold levels.
Volatility Analysis:
- Bollinger Bands (BB): The Bollinger Bands have shown a narrowing of the bands, indicating decreasing volatility and a possible period of consolidation.
- Average True Range (ATR): The ATR has shown a decrease in volatility over the last few days.
Volume Analysis:
- On-Balance Volume (OBV): The OBV indicator has been relatively stable, suggesting a balance between buying and selling pressure.
- Chaikin Money Flow (CMF): The CMF has been negative, indicating a slight distribution phase in the stock.
Key Observations:
- The trend indicators suggest a bullish sentiment in the stock price.
- Momentum indicators show signs of potential reversal or consolidation.
- Volatility indicators point towards a period of consolidation and decreasing volatility.
- Volume indicators indicate a balance between buying and selling pressure.
Conclusion:
Based on the analysis of the technical indicators, the stock price of SAGP is likely to experience sideways movement in the upcoming days. While the trend remains bullish, the momentum indicators suggest a possible consolidation phase. The narrowing Bollinger Bands and decreasing volatility further support the expectation of sideways movement. Traders may consider adopting a neutral stance and closely monitor key support and resistance levels for potential breakout opportunities.