Technical Analysis of SAMT 2024-05-10
Overview:
In analyzing the technical indicators for SAMT over the last 5 days, we will delve into the trend, momentum, volatility, and volume indicators to provide a comprehensive outlook on the possible stock price movement in the coming days. By examining these key indicators, we aim to offer valuable insights and predictions to guide your investment decisions.
Trend Analysis:
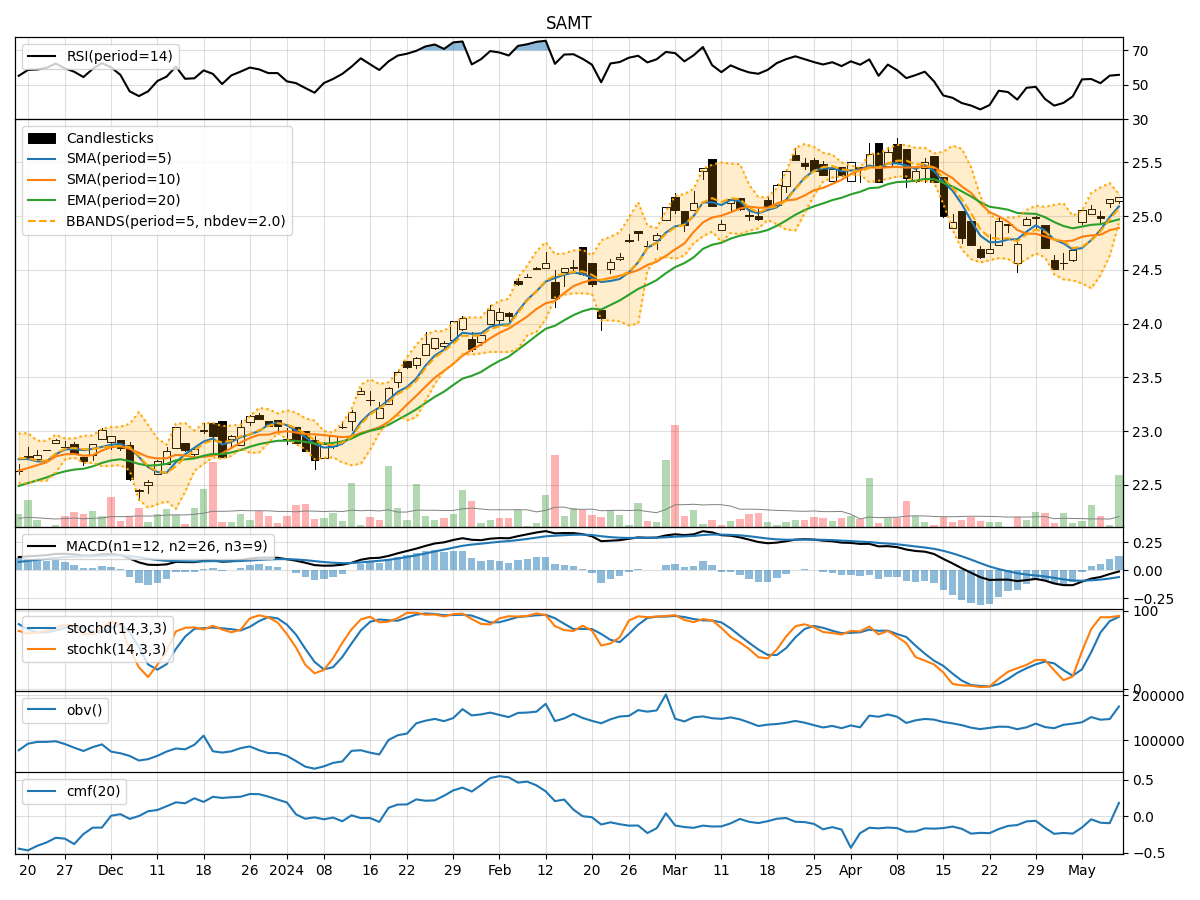
- Moving Averages (MA): The 5-day Moving Average (MA) has been consistently above the Simple Moving Average (SMA) and Exponential Moving Average (EMA), indicating a short-term bullish trend.
- MACD: The MACD line has been negative but showing signs of convergence towards the signal line, suggesting a potential shift towards a bullish momentum.
- MACD Histogram: The MACD Histogram has been gradually increasing, indicating strengthening bullish momentum.
Momentum Analysis:
- RSI: The Relative Strength Index (RSI) has been fluctuating around the neutral level of 50, indicating a lack of strong momentum in either direction.
- Stochastic Oscillator: Both %K and %D have been in the overbought zone, suggesting a potential reversal or consolidation phase.
- Williams %R: The Williams %R is hovering around the oversold territory, indicating a possible buying opportunity.
Volatility Analysis:
- Bollinger Bands: The stock price has been trading within the Bollinger Bands, with the bands narrowing, suggesting a period of low volatility.
- Bollinger %B: The %B indicator is above 0.5, indicating that the stock price is trading closer to the upper band.
Volume Analysis:
- On-Balance Volume (OBV): The OBV has shown mixed signals, with alternating positive and negative values, reflecting indecision among market participants.
- Chaikin Money Flow (CMF): The CMF has been negative, indicating selling pressure in the market.
Conclusion:
Based on the analysis of the technical indicators, the stock of SAMT is likely to experience sideways consolidation in the near term. The trend indicators suggest a potential bullish reversal, supported by the convergence of the MACD lines. However, the momentum indicators indicate a lack of strong buying or selling pressure, leading to a neutral stance. The volatility indicators point towards a period of low volatility, while the volume indicators reflect mixed market sentiment.
Therefore, the next few days for SAMT are likely to see sideways movement with a slight bullish bias. Traders may consider waiting for a clearer trend confirmation before making significant trading decisions. It is essential to monitor key levels and wait for a breakout or breakdown from the current consolidation phase to determine the next major price direction.