Technical Analysis of SAUG 2024-05-10
Overview:
In analyzing the technical indicators for SAUG stock over the last 5 days, we will delve into the trend, momentum, volatility, and volume indicators to provide a comprehensive outlook on the possible future stock price movement. By examining these key indicators, we aim to offer valuable insights and predictions for the upcoming trading days.
Trend Analysis:
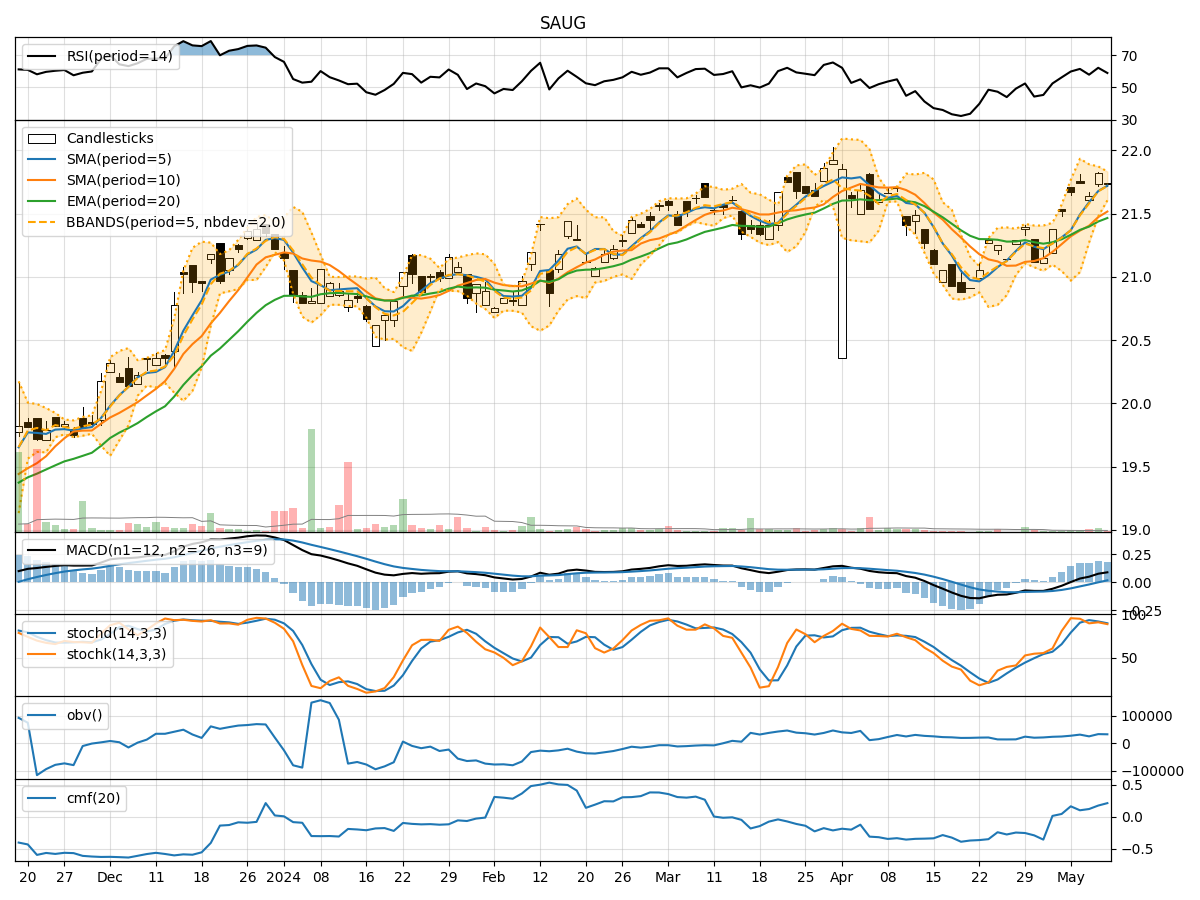
- Moving Averages (MA): The 5-day Moving Average (MA) has been trending above the Simple Moving Average (SMA) and Exponential Moving Average (EMA), indicating a short-term bullish trend.
- MACD: The MACD line has been consistently above the signal line, suggesting positive momentum in the stock price.
- MACD Histogram: The MACD Histogram has shown an increasing trend, indicating strengthening bullish momentum.
Momentum Analysis:
- RSI: The Relative Strength Index (RSI) has been fluctuating around the 60-65 range, indicating a neutral momentum.
- Stochastic Oscillator: Both %K and %D lines of the Stochastic Oscillator have been hovering around the overbought territory, suggesting a potential reversal or consolidation.
- Williams %R: The Williams %R has been oscillating in the oversold region, indicating a potential buying opportunity.
Volatility Analysis:
- Bollinger Bands: The Bollinger Bands have shown a narrowing of the bands, indicating decreasing volatility and a possible period of consolidation.
- Bollinger %B: The %B indicator has been fluctuating around the midline, suggesting a balanced market sentiment.
Volume Analysis:
- On-Balance Volume (OBV): The OBV indicator has shown mixed movements, reflecting indecision among market participants.
- Chaikin Money Flow (CMF): The CMF has been positive, indicating buying pressure in the stock.
Key Observations:
- The trend indicators suggest a bullish bias in the short term.
- Momentum indicators show a neutral to slightly overbought condition.
- Volatility indicators point towards a potential period of consolidation.
- Volume indicators reflect mixed participation from investors.
Conclusion:
Based on the analysis of the technical indicators, the next few days for SAUG stock are likely to see sideways movement with a slight bullish bias. Traders may observe a period of consolidation as the stock price stabilizes before potentially resuming its upward trajectory. It is advisable to closely monitor key support and resistance levels for potential entry and exit points.
Recommendation:
- Short-term Traders: Consider taking profits on existing positions and wait for clearer signals before entering new trades.
- Long-term Investors: Hold positions with a watchful eye on market developments and key technical levels.
- Risk Management: Implement stop-loss orders to protect capital in case of unexpected price movements.
By combining technical analysis with market insights, traders and investors can make well-informed decisions to navigate the dynamic stock market environment effectively.