Technical Analysis of SBB 2024-05-10
Overview:
In analyzing the technical indicators for SBB stock over the last 5 days, we will delve into the trend, momentum, volatility, and volume indicators to provide a comprehensive outlook on the possible future stock price movement. By examining these key indicators, we aim to offer valuable insights and recommendations for potential investors.
Trend Analysis:
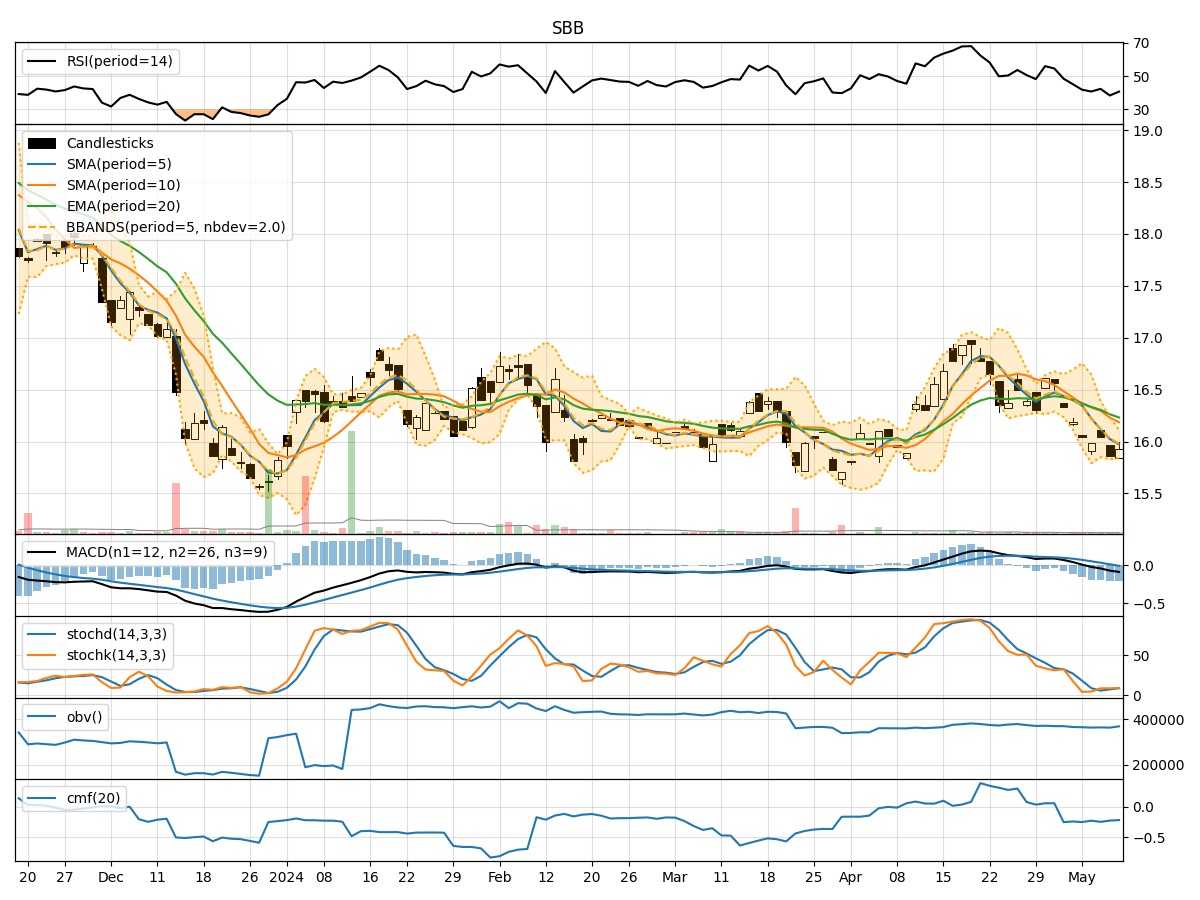
- Moving Averages (MA): The 5-day MA has been consistently below the closing prices, indicating a downward trend.
- MACD: The MACD line has been below the signal line, suggesting a bearish momentum.
Momentum Analysis:
- RSI: The RSI has been hovering around 40-42, indicating a neutral to slightly bearish momentum.
- Stochastic Oscillator: Both %K and %D have been relatively low, signaling a potential oversold condition.
Volatility Analysis:
- Bollinger Bands (BB): The stock price has been trading within the lower Bollinger Band, suggesting a potential oversold condition.
Volume Analysis:
- On-Balance Volume (OBV): The OBV has been consistently negative, indicating selling pressure.
- Chaikin Money Flow (CMF): The CMF has been negative, reflecting a lack of buying interest.
Key Observations:
- The stock is currently in a downtrend based on moving averages and MACD.
- Momentum indicators suggest a neutral to slightly bearish sentiment.
- Volatility indicators point towards a potential oversold condition.
- Volume indicators indicate selling pressure and a lack of buying interest.
Conclusion:
Based on the analysis of the technical indicators, the next few days' possible stock price movement for SBB is likely to be sideways to slightly bearish. The stock may continue to face selling pressure, but the oversold condition indicated by volatility indicators could lead to a temporary consolidation phase. Investors should exercise caution and closely monitor key support levels for potential buying opportunities.