Technical Analysis of SCAP 2024-05-10
Overview:
In analyzing the technical indicators for SCAP stock over the last 5 days, we will delve into the trend, momentum, volatility, and volume indicators to provide a comprehensive outlook on the possible stock price movement in the coming days. By examining these key indicators, we aim to offer valuable insights and predictions to guide your investment decisions.
Trend Analysis:
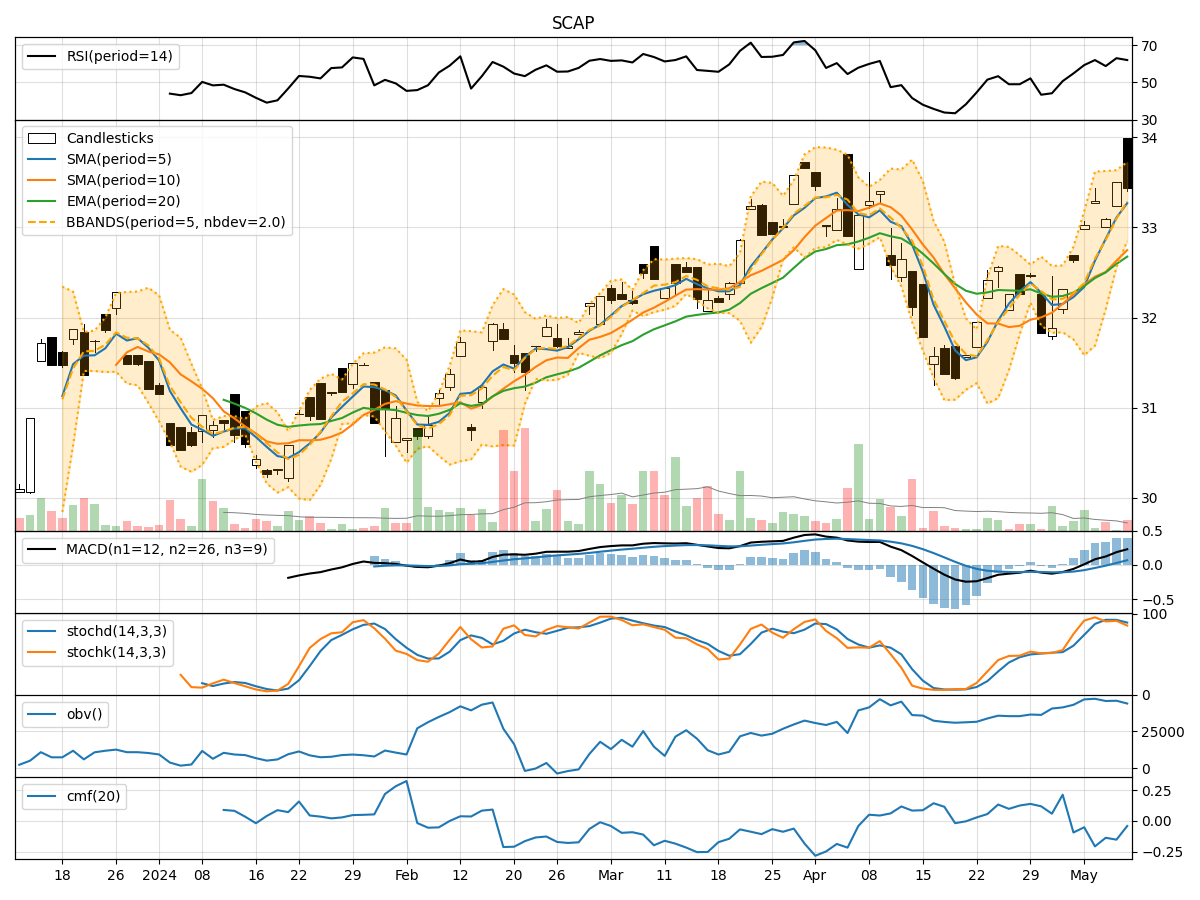
- Moving Averages (MA): The 5-day moving average (MA) has been consistently above the simple moving average (SMA) and exponential moving average (EMA) over the past 5 days, indicating a bullish trend.
- MACD: The MACD line has been consistently above the signal line, with both lines showing an upward trend, suggesting bullish momentum.
- MACD Histogram: The MACD histogram has been increasing, indicating strengthening bullish momentum.
Momentum Analysis:
- RSI: The Relative Strength Index (RSI) has been fluctuating around the overbought territory, suggesting a strong bullish momentum.
- Stochastic Oscillator: Both %K and %D lines of the Stochastic Oscillator have been in the overbought zone, indicating a strong bullish momentum.
- Williams %R: The Williams %R has been consistently in the oversold territory, signaling a strong bullish sentiment.
Volatility Analysis:
- Bollinger Bands: The stock price has been trading within the Bollinger Bands, with the bands narrowing, indicating decreasing volatility.
- Bollinger Band %B: The %B indicator has been hovering around 0.7, suggesting the stock is trading closer to the upper band.
Volume Analysis:
- On-Balance Volume (OBV): The OBV indicator has been fluctuating, indicating mixed buying and selling pressure.
- Chaikin Money Flow (CMF): The CMF has been negative, suggesting a slight bearish sentiment in the market.
Conclusion:
Based on the analysis of the technical indicators, the stock of SCAP is exhibiting strong bullish signals across trend and momentum indicators. The narrowing Bollinger Bands and mixed volume indicators may indicate a potential consolidation phase in the short term. However, considering the overall bullish momentum and trend strength, the outlook for the next few days is upward with a high probability of the stock price continuing its upward trajectory.
Key Takeaways:
- Bullish Momentum: Strong bullish momentum is evident from the RSI, Stochastic Oscillator, and MACD indicators.
- Consolidation Phase: The narrowing Bollinger Bands suggest a possible consolidation phase in the short term.
- Mixed Volume Signals: The OBV and CMF indicators show mixed signals, indicating a balance between buying and selling pressure.
In conclusion, the technical analysis points towards a bullish outlook for SCAP stock in the next few days, with the potential for further price appreciation. It is essential to monitor the indicators closely for any signs of reversal or trend change.