Technical Analysis of SCDL 2024-05-10
Overview:
In analyzing the technical indicators for SCDL over the last 5 days, we will delve into the trend, momentum, volatility, and volume indicators to provide a comprehensive outlook on the possible stock price movement in the coming days. By examining these key aspects, we aim to offer valuable insights and predictions for informed decision-making.
Trend Indicators:
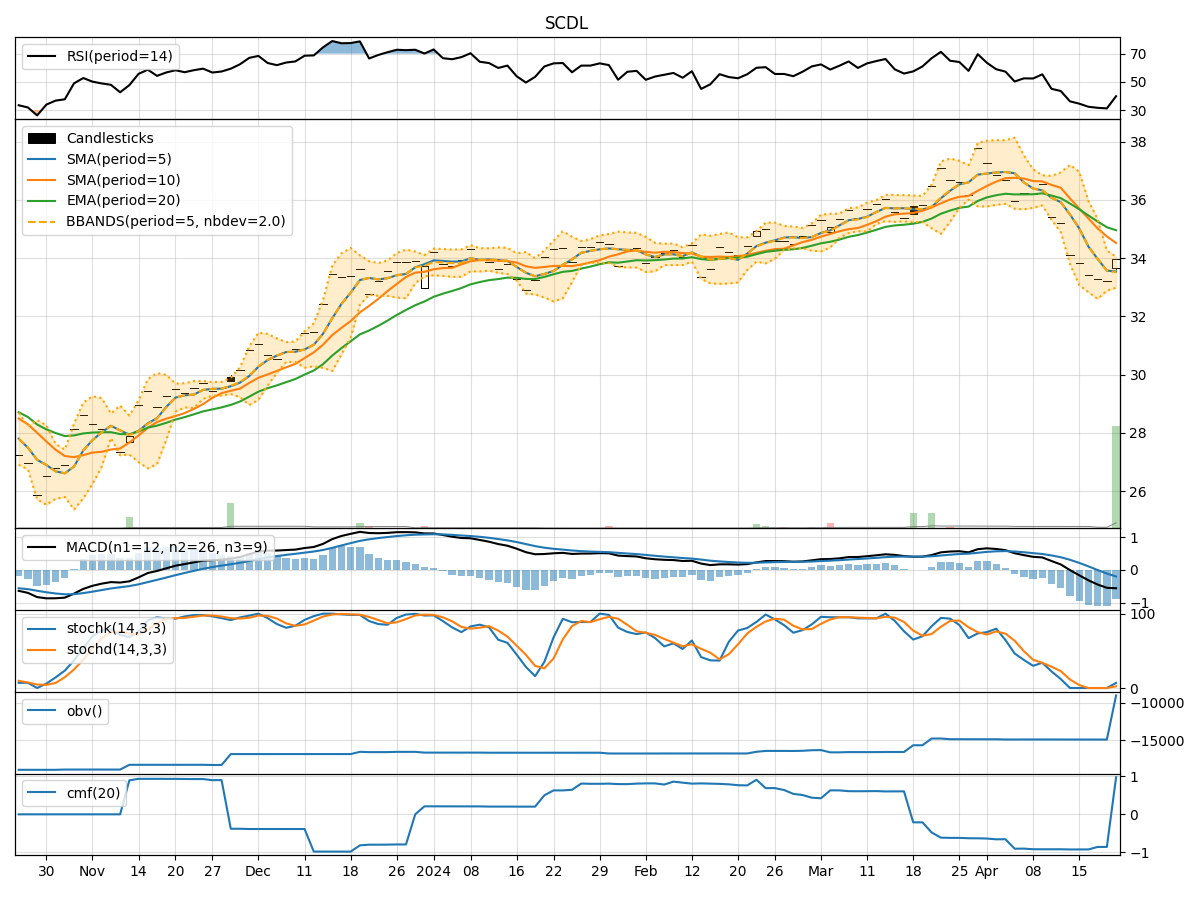
- Moving Averages (MA): The 5-day MA has been consistently above the 10-day SMA, indicating a short-term bullish trend. The EMA(20) has been steadily increasing, reflecting positive momentum.
- MACD: The MACD line has been above the signal line, suggesting bullish momentum. The MACD histogram has been rising, indicating strengthening bullish momentum.
Momentum Indicators:
- RSI: The RSI has been trending upwards and is currently in the overbought territory, signaling potential strength in the current uptrend.
- Stochastic Oscillator: Both %K and %D have been in the overbought zone, indicating a strong bullish momentum.
- Williams %R: The indicator has been consistently at 0, suggesting a strong bullish sentiment.
Volatility Indicators:
- Bollinger Bands (BB): The stock price has been trading within the upper Bollinger Band, indicating an overbought condition. The bands are widening, suggesting increased volatility.
- Bollinger %B: The %B indicator has been hovering around 0.8-0.9, indicating a relatively high price compared to the recent past.
Volume Indicators:
- On-Balance Volume (OBV): The OBV has been steadily increasing, reflecting accumulation by investors.
- Chaikin Money Flow (CMF): The CMF has been consistently positive, indicating strong buying pressure.
Key Observations and Opinions:
- Trend: The trend indicators suggest a strong bullish sentiment with positive moving averages and MACD signals.
- Momentum: Momentum indicators are firmly in the overbought territory, indicating a robust uptrend.
- Volatility: Increasing volatility, as seen in the widening Bollinger Bands, may lead to sharp price movements.
- Volume: Accumulation in OBV and positive CMF point towards strong buying interest.
Conclusion:
Based on the analysis of the technical indicators, the stock price of SCDL is likely to continue its upward trajectory in the next few days. The strong bullish trend, supported by momentum and volume indicators, suggests that the stock may experience further price appreciation. Traders and investors could consider maintaining a bullish outlook and look for opportunities to capitalize on the ongoing uptrend. It is essential to monitor the price action closely and set appropriate risk management strategies to navigate potential volatility in the market.