Technical Analysis of SCHF 2024-05-10
Overview:
In analyzing the technical indicators for SCHF over the last 5 days, we will delve into the trend, momentum, volatility, and volume indicators to provide a comprehensive outlook on the possible stock price movement in the coming days. By examining these key indicators, we aim to offer valuable insights and predictions for potential investors.
Trend Indicators:
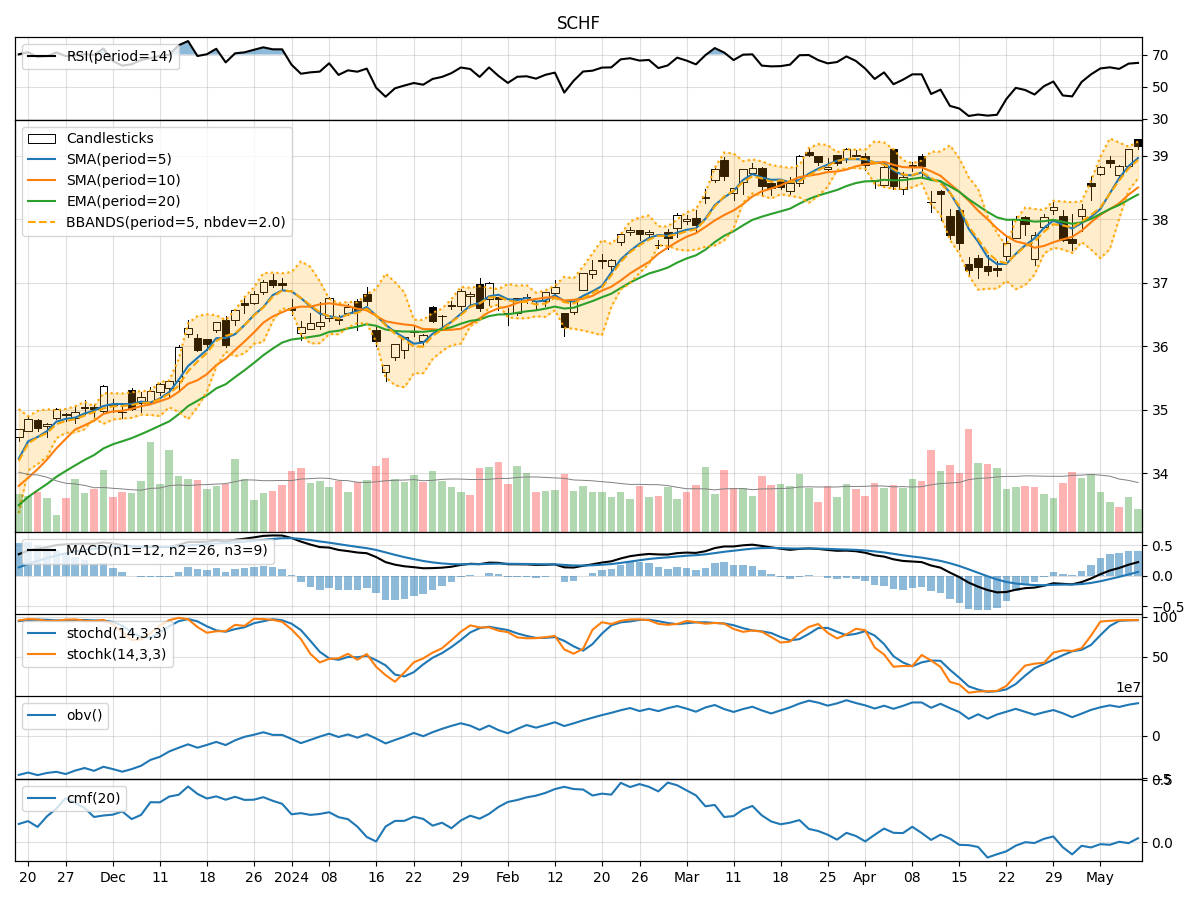
- Moving Averages (MA): The 5-day Moving Average has been consistently above the longer-term Simple Moving Average (SMA) and Exponential Moving Average (EMA), indicating a short-term bullish trend.
- MACD: The MACD line has been above the signal line for the past 5 days, with both lines showing an upward trend, suggesting bullish momentum.
- Momentum: The stock price has been trending upwards, with the MACD histogram also showing positive values, indicating increasing bullish momentum.
Momentum Indicators:
- RSI: The Relative Strength Index (RSI) has been in the range of 60-65, indicating a moderate level of buying pressure.
- Stochastic Oscillator: Both %K and %D lines have been consistently high, suggesting strong bullish momentum.
- Williams %R: The Williams %R is hovering around -5 to -7, indicating that the stock may be overbought in the short term.
Volatility Indicators:
- Bollinger Bands: The stock price has been trading within the upper Bollinger Band, indicating an overbought condition.
- Bollinger %B: The %B indicator is above 0.8, suggesting that the stock is trading at the upper end of its recent price range.
Volume Indicators:
- On-Balance Volume (OBV): The OBV has shown a slight increase over the last 5 days, indicating some accumulation by investors.
- Chaikin Money Flow (CMF): The CMF has been fluctuating around 0, suggesting a balance between buying and selling pressure.
Key Observations and Opinions:
- Trend: The trend indicators point towards a strong bullish sentiment in the short term.
- Momentum: Momentum indicators confirm the bullish trend, with strong buying pressure and overbought conditions.
- Volatility: Volatility indicators suggest that the stock is currently overbought and may experience a pullback.
- Volume: Volume indicators show a slight increase in buying pressure but no significant accumulation.
Conclusion:
Based on the analysis of the technical indicators, the next few days' possible stock price movement for SCHF is likely to be upward in the short term. However, considering the overbought conditions indicated by the volatility indicators, investors should be cautious of a potential pullback or consolidation in the near future. It is advisable to closely monitor the price action and key support levels to make informed trading decisions.