Technical Analysis of SCHI 2024-05-10
Overview:
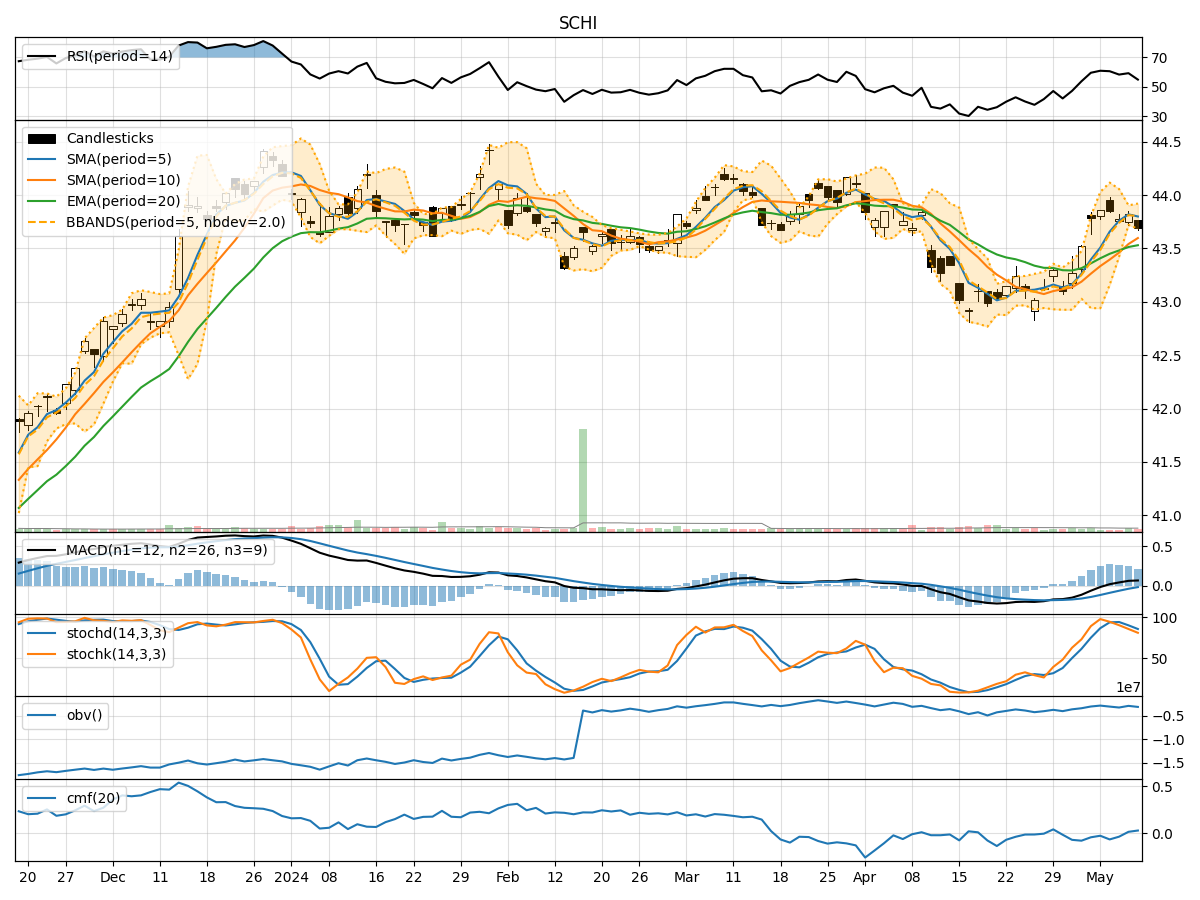
In analyzing the technical indicators for SCHI over the last 5 days, we will delve into the trend, momentum, volatility, and volume indicators to provide a comprehensive outlook on the possible stock price movement in the coming days. By examining these key aspects, we aim to offer valuable insights and predictions to guide your investment decisions.
Trend Analysis:
- Moving Averages (MA): The 5-day Moving Average (MA) has been consistently above the Simple Moving Average (SMA) and Exponential Moving Average (EMA), indicating a short-term uptrend.
- MACD: The MACD line has been above the signal line, with both lines showing an upward trend, suggesting bullish momentum.
- RSI: The Relative Strength Index (RSI) has been fluctuating around the 50 level, indicating a neutral stance in terms of momentum.
Momentum Analysis:
- Stochastic Oscillator: The Stochastic Oscillator has been gradually decreasing but remains in the overbought territory, signaling a potential reversal or consolidation.
- Williams %R: The Williams %R indicator has been moving lower into oversold territory, suggesting a possible buying opportunity in the near term.
Volatility Analysis:
- Bollinger Bands (BB): The Bollinger Bands have been narrowing, indicating decreasing volatility and a potential period of consolidation.
- BB %B: The %B indicator is hovering around the middle band, reflecting a balanced market sentiment.
Volume Analysis:
- On-Balance Volume (OBV): The OBV indicator has been relatively stable, showing no significant divergence from price movements.
- Chaikin Money Flow (CMF): The CMF has been negative, indicating some distribution in the stock.
Key Observations:
- The trend indicators suggest a bullish bias in the short term, supported by the MACD and moving averages.
- Momentum indicators show a mixed picture, with the Stochastic Oscillator hinting at a potential reversal while the Williams %R indicates oversold conditions.
- Volatility is decreasing, pointing towards a period of consolidation or a potential breakout.
- Volume indicators do not show strong divergence, indicating a lack of significant buying or selling pressure.
Conclusion:
Based on the analysis of the technical indicators, the stock price of SCHI is likely to experience sideways movement or consolidation in the next few days. While the trend remains slightly bullish, the momentum indicators suggest a possible reversal or period of indecision. The decreasing volatility and stable volume further support the view of a sideways market. Traders may consider waiting for clearer signals or confirmation of a new trend before making significant trading decisions.