Technical Analysis of SCHK 2024-05-10
Overview:
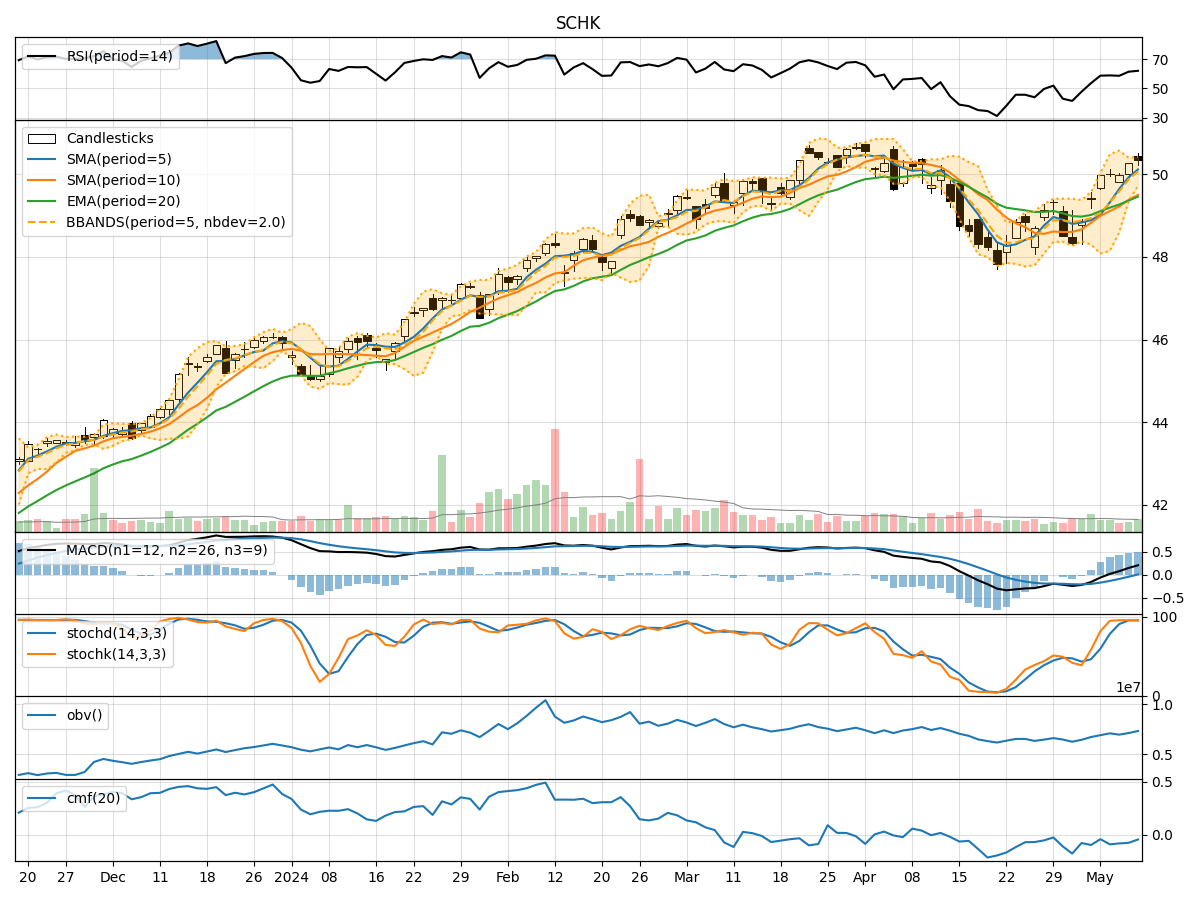
In analyzing the technical indicators for SCHK over the last 5 days, we will delve into the trend, momentum, volatility, and volume indicators to provide a comprehensive outlook on the possible stock price movement in the coming days. By examining these key aspects, we aim to offer valuable insights and predictions for informed decision-making.
Trend Analysis:
- Moving Averages (MA): The 5-day MA has been consistently rising, indicating a bullish trend in the short term.
- MACD: The MACD line has been above the signal line, suggesting positive momentum in the stock price.
- RSI: The RSI has been in the overbought territory, reflecting strong buying pressure.
Key Observation: The trend indicators point towards a bullish sentiment in the stock price.
Momentum Analysis:
- Stochastic Oscillator: Both %K and %D have been in the overbought zone, signaling potential price strength.
- Williams %R: The indicator has been hovering near oversold levels, indicating a possible reversal.
Key Observation: Momentum indicators suggest a mixed outlook with potential for a short-term pullback.
Volatility Analysis:
- Bollinger Bands: The bands have been narrowing, indicating decreasing volatility and a possible period of consolidation.
- Bollinger %B: The %B indicator has been hovering around 0.8, suggesting the stock is trading near the upper band.
Key Observation: Volatility indicators point towards a consolidation phase in the stock price.
Volume Analysis:
- On-Balance Volume (OBV): The OBV has shown a slight decline, indicating some distribution in the stock.
- Chaikin Money Flow (CMF): The CMF has been negative, suggesting outflows from the stock.
Key Observation: Volume indicators reflect a bearish sentiment with potential selling pressure.
Conclusion:
Based on the analysis of trend, momentum, volatility, and volume indicators, the next few days' possible stock price movement for SCHK is likely to be sideways to slightly bearish. While the trend indicators signal a bullish sentiment, the momentum indicators suggest a potential short-term pullback. Volatility indicators point towards a consolidation phase, and volume indicators indicate selling pressure.
Overall Assessment: The stock is expected to experience a period of consolidation with a slight bearish bias in the near term. Traders may consider monitoring key support and resistance levels for potential entry or exit points. It is advisable to exercise caution and wait for clearer signals before making significant trading decisions.