Technical Analysis of SCHM 2024-05-10
Overview:
In analyzing the technical indicators for SCHM over the last 5 days, we will delve into the trend, momentum, volatility, and volume indicators to provide a comprehensive outlook on the possible stock price movement in the coming days.
Trend Analysis:
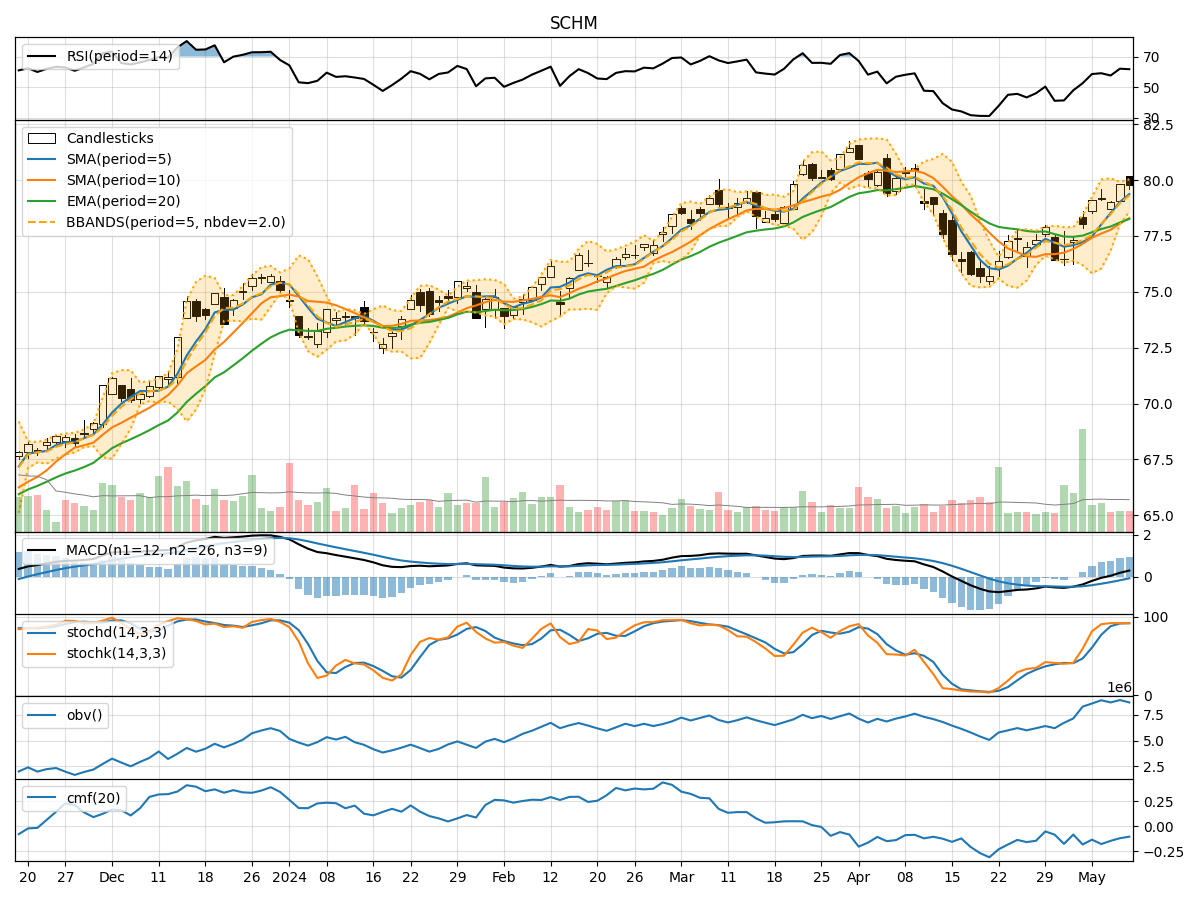
- Moving Averages (MA): The 5-day Moving Average (MA) has been consistently above the Simple Moving Average (SMA) and Exponential Moving Average (EMA), indicating a bullish trend.
- MACD: The MACD line has been consistently above the signal line, with the MACD histogram showing an increasing positive trend, further supporting the bullish sentiment.
Momentum Analysis:
- RSI: The Relative Strength Index (RSI) has been hovering around the 60-62 range, indicating a neutral to slightly bullish momentum.
- Stochastic Oscillator: Both %K and %D lines of the Stochastic Oscillator have been in the overbought zone, suggesting a potential reversal or consolidation.
Volatility Analysis:
- Bollinger Bands (BB): The stock price has been trading within the Bollinger Bands, with the bands narrowing, indicating decreasing volatility.
- Bollinger %B: The %B indicator has been fluctuating around 0.7-0.8, suggesting the stock is trading closer to the upper band.
Volume Analysis:
- On-Balance Volume (OBV): The OBV has shown a slight increase over the last 5 days, indicating some accumulation by investors.
- Chaikin Money Flow (CMF): The CMF has been negative, suggesting some selling pressure in the stock.
Conclusion:
Based on the analysis of the technical indicators: - Trend: The trend is bullish based on moving averages and MACD. - Momentum: The momentum is neutral to slightly bullish based on RSI and Stochastic Oscillator. - Volatility: The volatility is decreasing based on Bollinger Bands. - Volume: The volume is showing mixed signals with slight accumulation indicated by OBV but selling pressure shown by CMF.
Overall View:
Considering the bullish trend and neutral to slightly bullish momentum, we can expect the stock price of SCHM to continue its upward movement in the coming days. However, caution is advised as the Stochastic Oscillator indicates potential overbought conditions, and the CMF suggests some selling pressure. Traders should monitor the price action closely for any signs of a reversal or consolidation.