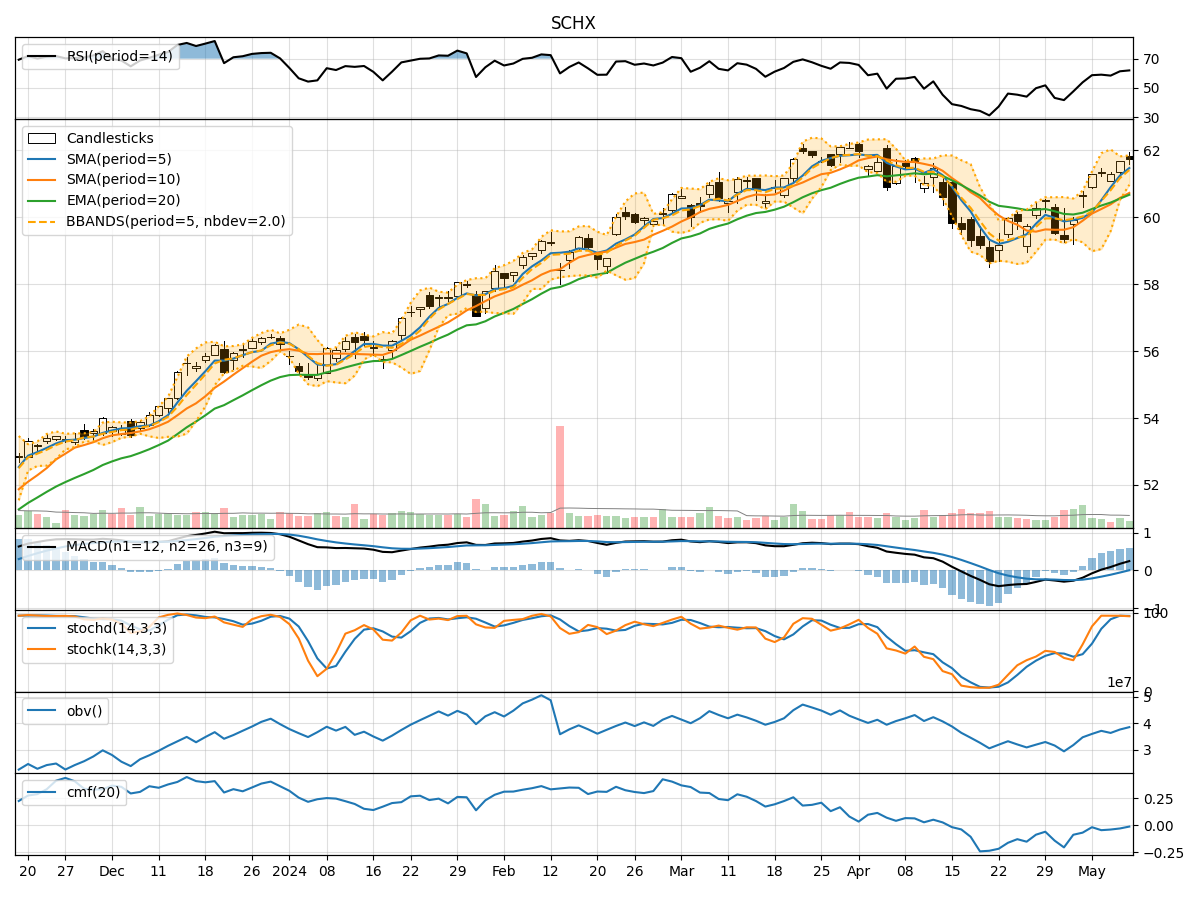
Technical Analysis of SCHX 2024-05-10
Overview:
In analyzing the technical indicators for SCHX over the last 5 days, we will delve into the trend, momentum, volatility, and volume indicators to provide a comprehensive outlook on the possible stock price movement in the coming days. By examining these key indicators, we aim to offer valuable insights and predictions for potential investors.
Trend Indicators:
- Moving Averages (MA): The 5-day Moving Average has been consistently above the 10-day Simple Moving Average, indicating a short-term bullish trend.
- Exponential Moving Average (EMA): The EMA has been showing an upward trend, suggesting positive momentum in the stock price.
- Moving Average Convergence Divergence (MACD): The MACD and Signal line have been in positive territory, indicating a bullish trend.
Key Observation: The trend indicators suggest a bullish sentiment in the short term.
Momentum Indicators:
- Relative Strength Index (RSI): RSI values have been in the overbought territory, indicating a strong bullish momentum.
- Stochastic Oscillator: Both %K and %D have been consistently high, signaling strong buying pressure.
- Williams %R (Willams %R): The Williams %R has been fluctuating around oversold levels, suggesting potential buying opportunities.
Key Observation: Momentum indicators reflect a strong bullish momentum in the stock.
Volatility Indicators:
- Bollinger Bands (BB): The stock price has been trading within the Bollinger Bands, indicating normal volatility.
- Bollinger Band Width (BBW): The BBW has been relatively stable, suggesting consistent volatility levels.
Key Observation: Volatility indicators show a stable and normal volatility environment.
Volume Indicators:
- On-Balance Volume (OBV): The OBV has been declining, indicating a decrease in buying pressure.
- Chaikin Money Flow (CMF): The CMF has been negative, suggesting a lack of buying interest in the stock.
Key Observation: Volume indicators point towards a decrease in buying pressure and lack of significant buying interest.
Conclusion:
Based on the analysis of trend, momentum, volatility, and volume indicators, the overall outlook for SCHX in the next few days is bullish. The trend indicators suggest a bullish sentiment, supported by strong momentum indicators indicating a robust buying pressure. Although volatility remains stable, the decrease in buying pressure as indicated by volume indicators may lead to some consolidation or minor pullbacks in the stock price.
Key Conclusion: The stock is likely to experience upward movement in the coming days, with potential minor corrections due to decreased buying pressure. Investors may consider entering long positions with caution to capitalize on the bullish momentum.