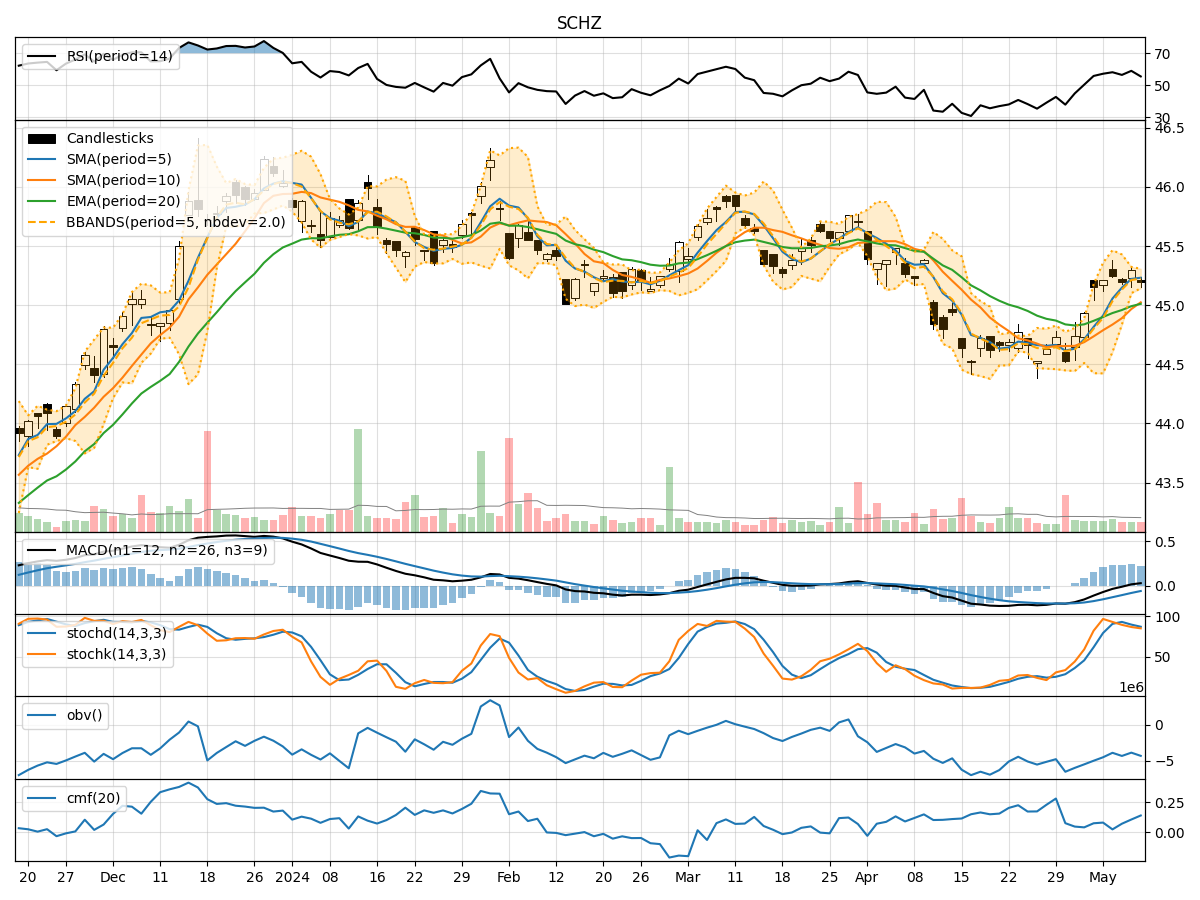
Technical Analysis of SCHZ 2024-05-10
Overview:
In analyzing the technical indicators for SCHZ over the last 5 days, we will delve into the trend, momentum, volatility, and volume indicators to provide a comprehensive outlook on the possible stock price movement in the coming days.
Trend Analysis:
- Moving Averages (MA): The 5-day Moving Average (MA) has been consistently above the Simple Moving Average (SMA) and Exponential Moving Average (EMA), indicating a bullish trend.
- MACD: The MACD line has been consistently above the signal line, with both lines showing an upward trend, suggesting bullish momentum.
- RSI: The Relative Strength Index (RSI) has been fluctuating around the overbought territory, indicating strong buying pressure.
Momentum Analysis:
- Stochastic Oscillator: The Stochastic Oscillator has been in the overbought zone, suggesting a potential reversal or consolidation.
- Williams %R: The Williams %R has been consistently in the oversold territory, indicating a bearish sentiment.
Volatility Analysis:
- Bollinger Bands: The Bollinger Bands have been narrowing, indicating decreasing volatility and a potential breakout in the near future.
Volume Analysis:
- On-Balance Volume (OBV): The OBV has shown mixed signals, with some days seeing positive volume accumulation and others showing distribution.
- Chaikin Money Flow (CMF): The CMF has been positive, indicating buying pressure in the market.
Key Observations:
- The trend indicators suggest a bullish sentiment, supported by the moving averages and MACD.
- Momentum indicators show conflicting signals, with the Stochastic Oscillator in the overbought zone and Williams %R in the oversold territory.
- Volatility is decreasing, indicating a potential period of consolidation before a breakout.
- Volume indicators show mixed signals, with OBV reflecting some distribution but CMF indicating buying pressure.
Conclusion:
Based on the analysis of the technical indicators, the stock price of SCHZ is likely to experience sideways movement or consolidation in the next few days. The conflicting signals from momentum indicators suggest a potential tug of war between buyers and sellers, leading to a period of indecision in the market. Traders should exercise caution and wait for a clearer trend to emerge before making significant trading decisions.