Technical Analysis of SCLZ 2024-05-10
Overview:
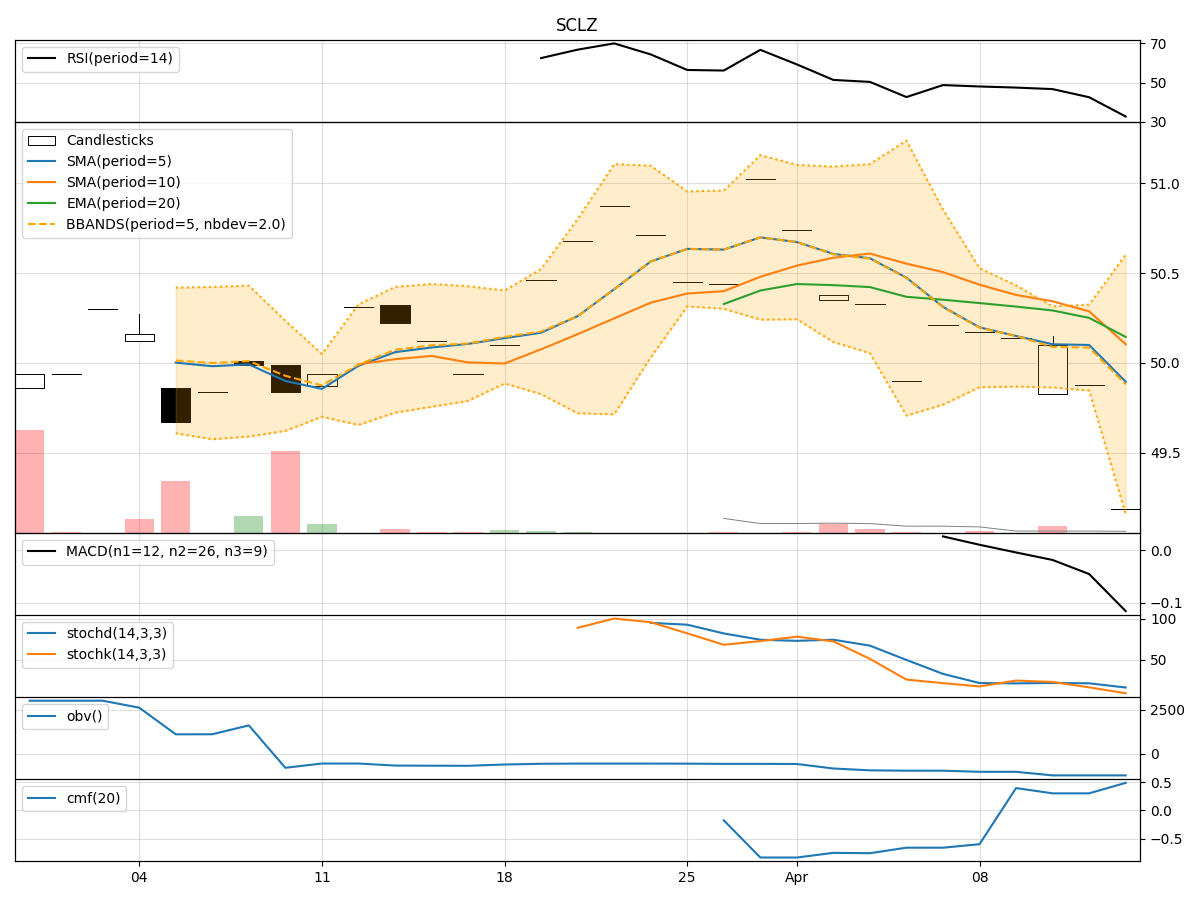
In the last 5 trading days, SCLZ stock has shown a consistent uptrend in both price and volume. Various technical indicators across trend, momentum, volatility, and volume categories suggest a bullish sentiment. The Moving Average Convergence Divergence (MACD) indicator indicates a strengthening bullish trend, while the Relative Strength Index (RSI) and Stochastic Oscillator suggest the stock is in overbought territory. Bollinger Bands show an expanding volatility range, and On-Balance Volume (OBV) remains positive.
Trend Analysis:
- Moving Averages (MA): The 5-day MA has been consistently above the 10-day Simple Moving Average (SMA), indicating a short-term bullish trend.
- MACD: The MACD line has been consistently above the signal line, indicating a strong bullish momentum.
- Conclusion: Upward trend with strong bullish momentum.
Momentum Analysis:
- RSI: The RSI is in the overbought zone above 70, suggesting a potential reversal or consolidation.
- Stochastic Oscillator: Both %K and %D are in the overbought region, indicating a possible pullback.
- Conclusion: Momentum indicators suggest a potential short-term correction or consolidation.
Volatility Analysis:
- Bollinger Bands (BB): The bands have been widening, indicating increasing volatility in the stock price.
- Conclusion: Expect higher volatility in the coming days.
Volume Analysis:
- On-Balance Volume (OBV): The OBV has been steadily increasing, indicating strong buying pressure.
- Conclusion: Volume supports the bullish trend.
Overall Conclusion:
Based on the technical indicators and analysis: - The stock is currently in an upward trend with strong bullish momentum. - However, overbought conditions indicated by the RSI and Stochastic Oscillator suggest a potential short-term correction or consolidation. - Increasing volatility as per Bollinger Bands may lead to larger price swings in the near future. - The positive OBV indicates continued buying interest in the stock.
Forecast:
Considering the overall analysis, the next few days may see a short-term correction or consolidation in the stock price due to overbought conditions. Traders should be cautious of potential pullbacks, but the overall trend remains bullish. Keep a close eye on the RSI and Stochastic Oscillator for signs of a reversal. Additionally, monitor the expanding Bollinger Bands for potential breakout or breakdown scenarios.
Recommendation:
- Short-term traders: Consider taking profits or tightening stop-loss levels to protect gains during the expected correction phase.
- Long-term investors: Use any potential dips as buying opportunities to capitalize on the overall bullish trend.
Always remember to combine technical analysis with fundamental research for a comprehensive investment decision.