Technical Analysis of SCMB 2024-05-10
Overview:
In analyzing the technical indicators for SCMB over the last 5 days, we will delve into the trend, momentum, volatility, and volume indicators to provide a comprehensive outlook on the possible stock price movement in the coming days.
Trend Analysis:
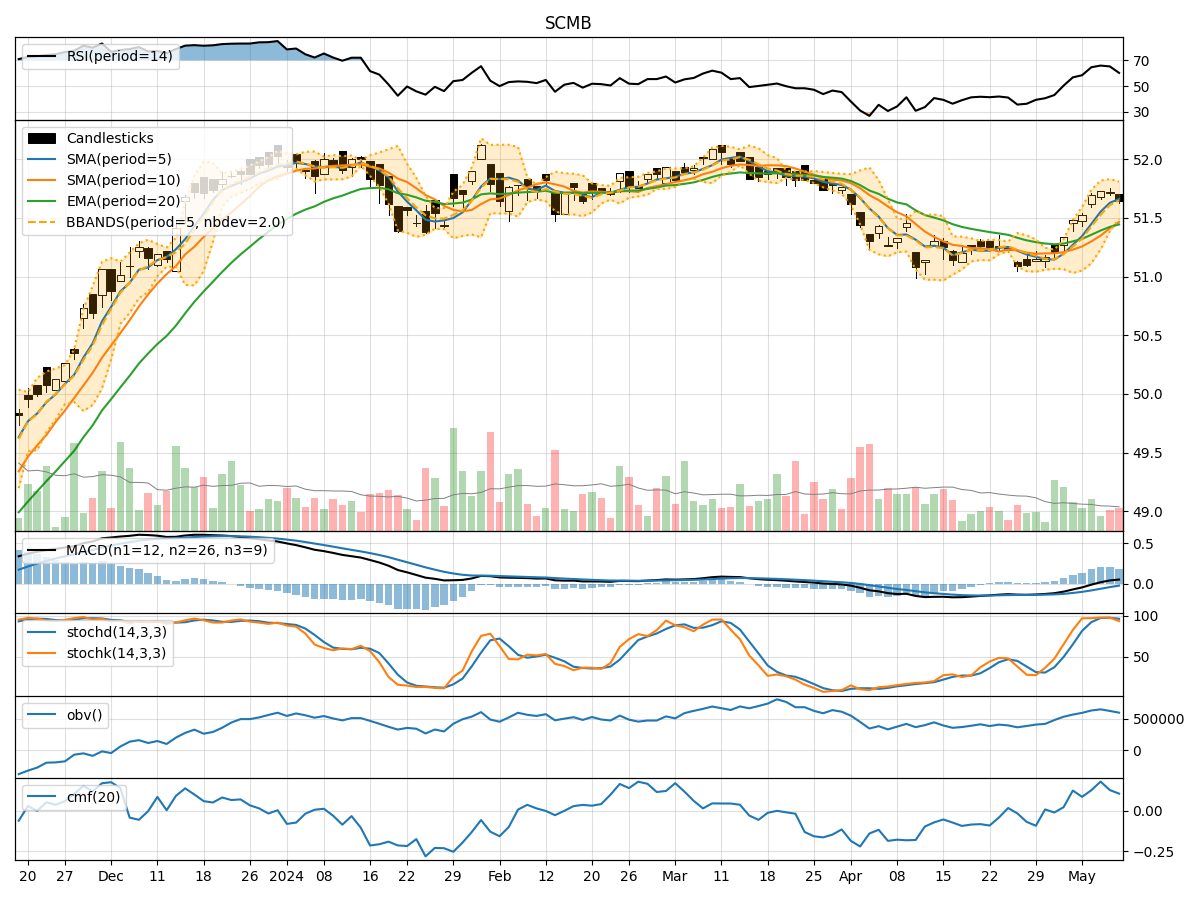
- Moving Averages (MA): The 5-day Moving Average (MA) has been consistently above the Simple Moving Average (SMA) and Exponential Moving Average (EMA), indicating a bullish trend.
- MACD: The MACD line has been consistently above the signal line, with the MACD Histogram showing positive values, suggesting a bullish momentum in the short term.
Momentum Analysis:
- RSI: The Relative Strength Index (RSI) has been fluctuating in the overbought territory, indicating strong buying momentum.
- Stochastic Oscillator: Both %K and %D lines have been in the overbought zone, suggesting a potential reversal or consolidation.
Volatility Analysis:
- Bollinger Bands (BB): The stock price has been trading within the upper Bollinger Band, indicating an overbought condition.
- Bollinger Band Width (BBW): The Bollinger Band Width has been narrowing, suggesting a decrease in volatility.
Volume Analysis:
- On-Balance Volume (OBV): The OBV has been showing a mixed trend, indicating some divergence between price and volume movements.
- Chaikin Money Flow (CMF): The CMF has been positive, suggesting buying pressure in the stock.
Key Observations:
- The trend indicators suggest a bullish sentiment in the short term.
- Momentum indicators show a strong buying momentum but also hint at a potential reversal due to overbought conditions.
- Volatility indicators point towards a decrease in volatility and a possible consolidation phase.
- Volume indicators indicate mixed signals with some divergence between price and volume movements.
Conclusion:
Based on the analysis of the technical indicators, the next few days' possible stock price movement for SCMB is likely to be sideways or consolidating with a potential for a slight pullback due to overbought conditions indicated by the momentum indicators. Traders should exercise caution and consider taking profits or implementing risk management strategies in anticipation of a possible correction.