Technical Analysis of SCYB 2024-05-10
Overview:
In analyzing the technical indicators for SCYB over the last 5 days, we will delve into the trend, momentum, volatility, and volume indicators to provide a comprehensive outlook on the possible stock price movement in the coming days. By examining these key aspects, we aim to offer valuable insights and predictions to guide your investment decisions.
Trend Analysis:
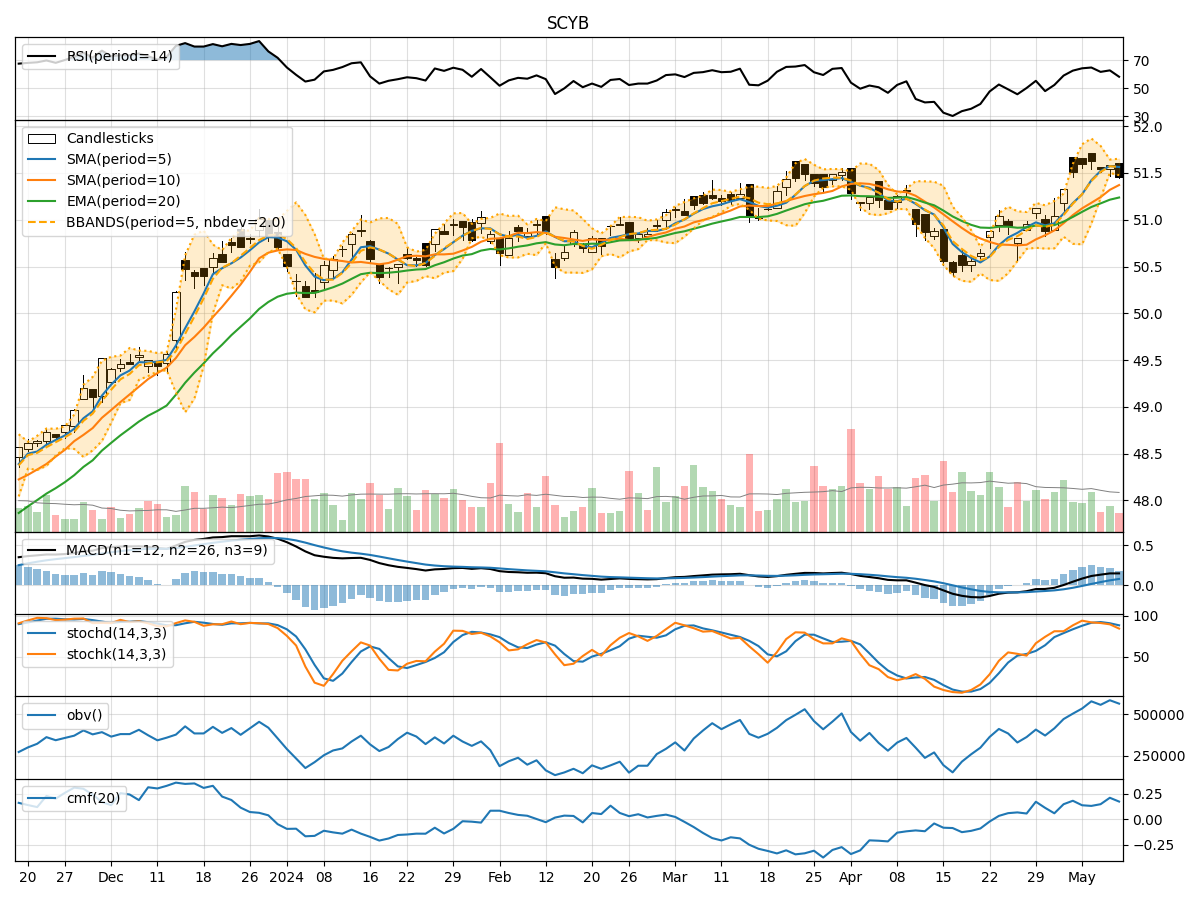
- Moving Averages (MA): The 5-day Moving Average (MA) has been relatively stable around the mid $51 range, indicating a neutral trend.
- MACD: The Moving Average Convergence Divergence (MACD) has shown a slight positive trend, with the MACD line consistently above the signal line.
- EMA: The Exponential Moving Average (EMA) has been gradually increasing, suggesting a bullish sentiment in the short term.
Momentum Analysis:
- RSI: The Relative Strength Index (RSI) has been fluctuating around the mid-60s, indicating a balanced momentum.
- Stochastic Oscillator: Both %K and %D have been declining, signaling a potential bearish momentum.
- Williams %R: The Williams %R is in the oversold territory, suggesting a possible reversal in momentum.
Volatility Analysis:
- Bollinger Bands: The Bollinger Bands have been narrowing, indicating decreasing volatility in the stock price.
- Bollinger %B: The %B indicator is hovering around the middle range, reflecting a consolidation phase.
- Average True Range (ATR): The ATR has been relatively stable, suggesting a lack of significant price fluctuations.
Volume Analysis:
- On-Balance Volume (OBV): The OBV has shown a slight increase, indicating a potential accumulation of the stock.
- Chaikin Money Flow (CMF): The CMF has been positive, suggesting buying pressure in the market.
Conclusion:
Based on the analysis of the technical indicators, the stock of SCYB is currently exhibiting mixed signals. - Trend: The trend indicators suggest a neutral to slightly bullish outlook. - Momentum: The momentum indicators are conflicting, with RSI neutral, Stochastic Oscillator bearish, and Williams %R oversold. - Volatility: Volatility is decreasing, indicating a period of consolidation. - Volume: The volume indicators show a slight increase in buying pressure.
Overall Assessment:
- Key Observation: The stock is likely to experience sideways movement in the near term, with a potential for a slight upward bias based on the trend indicators.
- Recommendation: It is advisable to closely monitor the momentum indicators for any potential shifts in market sentiment. Consider setting tight stop-loss levels to manage risk effectively.
In conclusion, while the technical indicators provide valuable insights, it is essential to consider other fundamental factors and market dynamics before making investment decisions. Stay vigilant and adapt your strategy based on real-time market developments.