Technical Analysis of SCZ 2024-05-10
Overview:
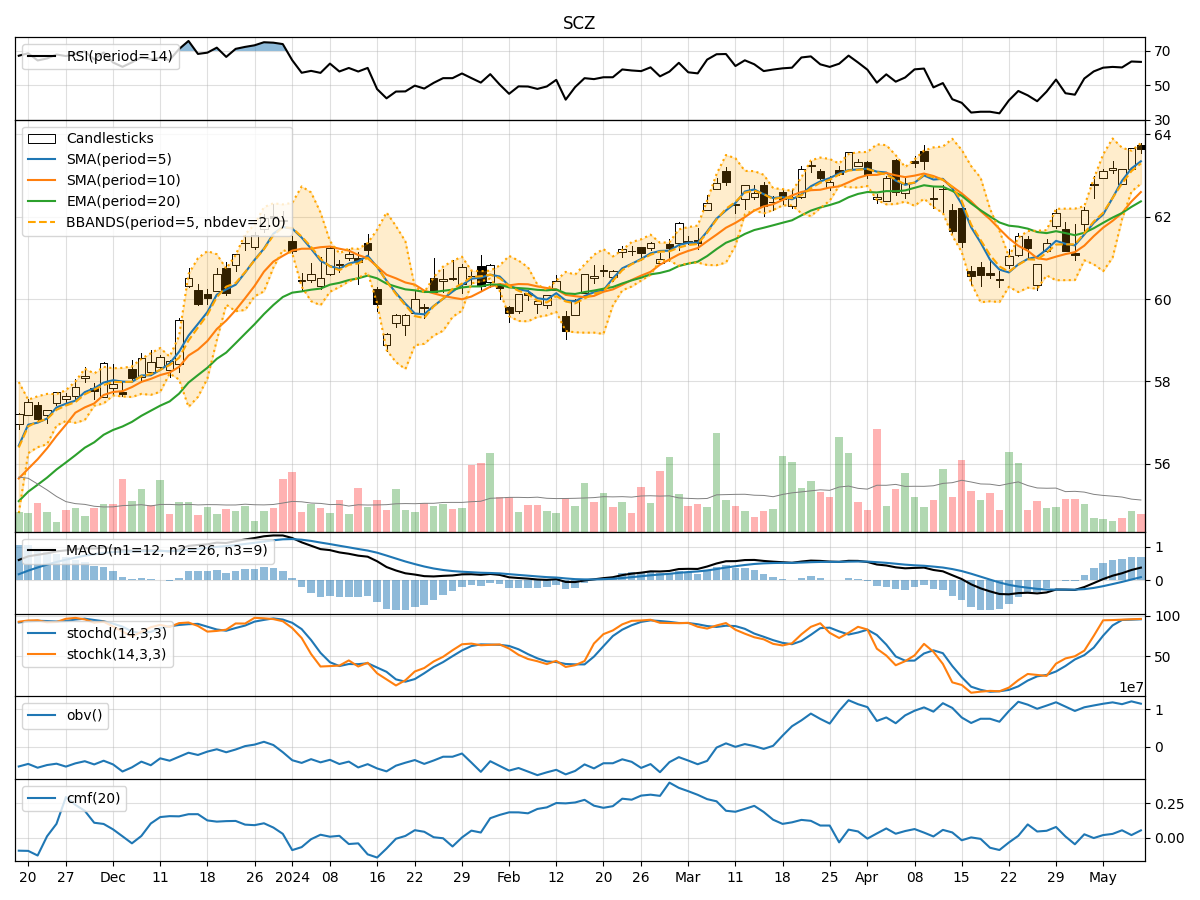
In analyzing the technical indicators for SCZ over the last 5 days, we will delve into the trend, momentum, volatility, and volume indicators to provide a comprehensive outlook on the possible stock price movement. By examining these key indicators, we aim to offer valuable insights and predictions for the upcoming days.
Trend Indicators:
- Moving Averages (MA): The 5-day MA has been consistently above the closing prices, indicating a bullish trend.
- MACD: The MACD line has been above the signal line, suggesting a bullish momentum.
- MACD Histogram: The histogram has been increasing, indicating strengthening bullish momentum.
Key Observation: The trend indicators point towards a bullish sentiment in the stock price movement.
Momentum Indicators:
- RSI: The RSI has been in the overbought territory, signaling a strong bullish momentum.
- Stochastic Oscillator: Both %K and %D have been in the overbought zone, indicating a strong bullish momentum.
- Williams %R: The indicator has been in the oversold region, suggesting a potential reversal.
Key Observation: Momentum indicators reflect a strong bullish sentiment in the stock.
Volatility Indicators:
- Bollinger Bands: The stock price has been trading within the upper Bollinger Band, indicating high volatility.
- Bollinger Band Width: The band width has been narrowing, suggesting a potential decrease in volatility.
Key Observation: Volatility indicators show a high volatility environment in the stock price.
Volume Indicators:
- On-Balance Volume (OBV): The OBV has been fluctuating, indicating mixed buying and selling pressure.
- Chaikin Money Flow (CMF): The CMF has been positive, suggesting a bullish money flow.
Key Observation: Volume indicators present a mixed outlook with a slight bullish bias.
Conclusion:
Based on the analysis of trend, momentum, volatility, and volume indicators, the overall outlook for SCZ in the next few days is bullish. The trend indicators, momentum indicators, and volume indicators all point towards a continuation of the bullish sentiment in the stock price movement. However, the high volatility indicated by the Bollinger Bands warrants caution as sudden price swings may occur.
Therefore, the next few days are likely to see an upward movement in the stock price, with potential for further gains. Traders and investors should consider capitalizing on the bullish momentum while monitoring the volatility levels closely.
This analysis is based on the technical indicators provided and should be complemented with fundamental analysis for a comprehensive investment decision.