Technical Analysis of SDG 2024-05-10
Overview:
In analyzing the technical indicators for SDG stock over the last 5 days, we will delve into the trend, momentum, volatility, and volume indicators to provide a comprehensive outlook on the possible stock price movement in the coming days. By examining these key aspects, we aim to offer valuable insights and predictions for potential investors.
Trend Indicators:
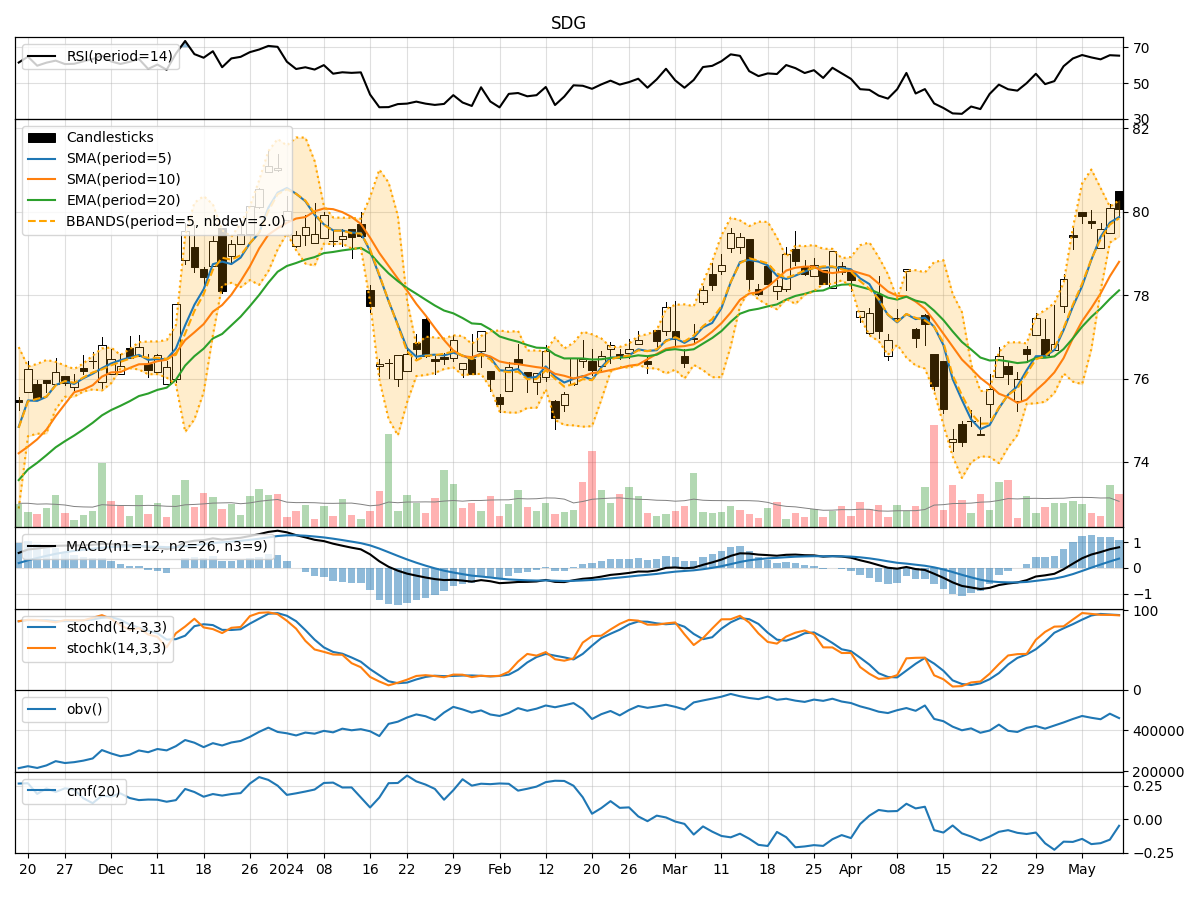
- Moving Averages (MA): The 5-day moving average has been consistently above the longer-term simple moving average (SMA) and exponential moving average (EMA), indicating a bullish trend.
- MACD: The MACD line has been consistently above the signal line, with both lines showing an upward trend, suggesting bullish momentum.
- MACD Histogram: The histogram has been increasing over the past 5 days, indicating strengthening bullish momentum.
Momentum Indicators:
- RSI: The Relative Strength Index (RSI) has been in the overbought territory but has not shown extreme levels, indicating potential for further upside.
- Stochastic Oscillator: Both %K and %D lines have been relatively high but not in the extreme overbought zone, suggesting room for further upward movement.
- Williams %R: The Williams %R is in the oversold region, indicating a potential reversal to the upside.
Volatility Indicators:
- Bollinger Bands: The price has been trading within the Bollinger Bands, with the bands narrowing slightly, suggesting a period of consolidation.
- Bollinger %B: The %B indicator is hovering around the midline, indicating a balanced market sentiment.
Volume Indicators:
- On-Balance Volume (OBV): The OBV has shown mixed signals, with some days seeing selling pressure and others showing accumulation, indicating indecision in the market.
- Chaikin Money Flow (CMF): The CMF has been negative over the past 5 days, reflecting a lack of strong buying pressure.
Key Observations:
- The trend indicators suggest a strong bullish bias in the short term.
- Momentum indicators indicate a potential for further upside but also show signs of overbought conditions.
- Volatility indicators point towards a period of consolidation.
- Volume indicators reflect mixed signals, with no clear accumulation or distribution pattern.
Conclusion:
Based on the analysis of the technical indicators, the next few days for SDG stock are likely to see further upward movement with a potential for consolidation as the price continues its bullish trend. Traders should be cautious of overbought conditions indicated by some momentum indicators and monitor for any signs of reversal. Overall, the outlook remains bullish in the short term, but investors should exercise caution and consider risk management strategies in their trading decisions.