Technical Analysis of SDOG 2024-05-10
Overview:
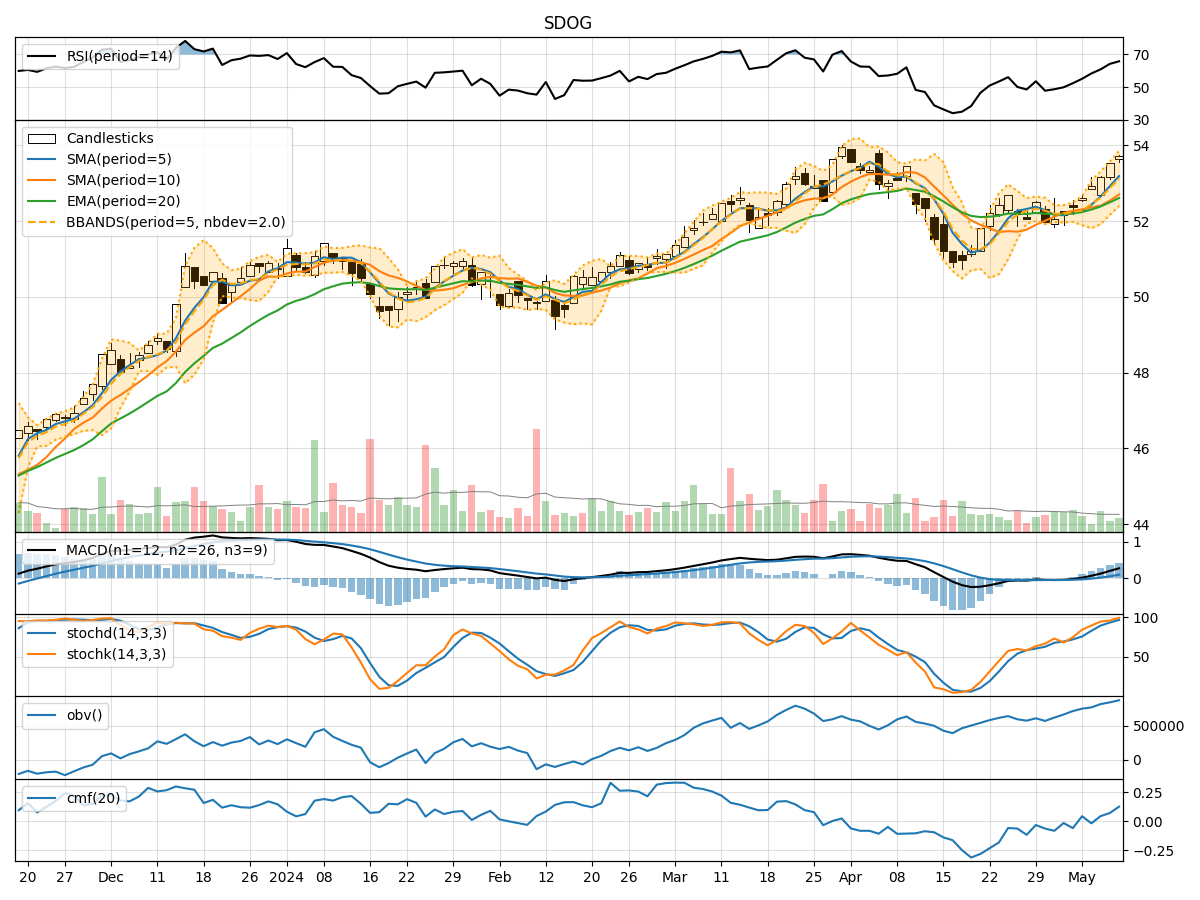
In analyzing the technical indicators for SDOG over the last 5 days, we will delve into the trend, momentum, volatility, and volume indicators to provide a comprehensive outlook on the possible stock price movement in the coming days. By examining these key indicators, we aim to offer valuable insights and predictions for informed decision-making.
Trend Indicators:
- Moving Averages (MA): The 5-day MA has been consistently rising, indicating a bullish trend in the short term.
- MACD: The MACD line has been above the signal line, suggesting positive momentum.
- RSI: The RSI has been increasing, reflecting strengthening buying pressure.
Momentum Indicators:
- Stochastic Oscillator: Both %K and %D have been in overbought territory, signaling a potential reversal.
- Williams %R: The indicator has been in oversold territory, hinting at a possible upward movement.
Volatility Indicators:
- Bollinger Bands: The stock price has been trading within the bands, indicating stable volatility.
- BB%: The %B has been fluctuating within a reasonable range, suggesting no extreme price movements.
Volume Indicators:
- On-Balance Volume (OBV): The OBV has been steadily increasing, indicating accumulation by investors.
- Chaikin Money Flow (CMF): The CMF has been positive, reflecting buying pressure.
Key Observations:
- The trend indicators show a bullish sentiment in the short term.
- Momentum indicators suggest a potential reversal in the overbought territory.
- Volatility remains stable with no significant price swings.
- Volume indicators indicate accumulation and positive buying pressure.
Conclusion:
Based on the analysis of the technical indicators, the stock is likely to experience further upward movement in the coming days. However, caution is advised as the momentum indicators signal a potential reversal from overbought levels. Traders should closely monitor the stochastic oscillator for a possible downturn. Overall, the trend remains bullish, supported by increasing buying pressure and positive volume flow. Investors may consider buying on dips for potential gains in the short term.