Technical Analysis of SECT 2024-05-10
Overview:
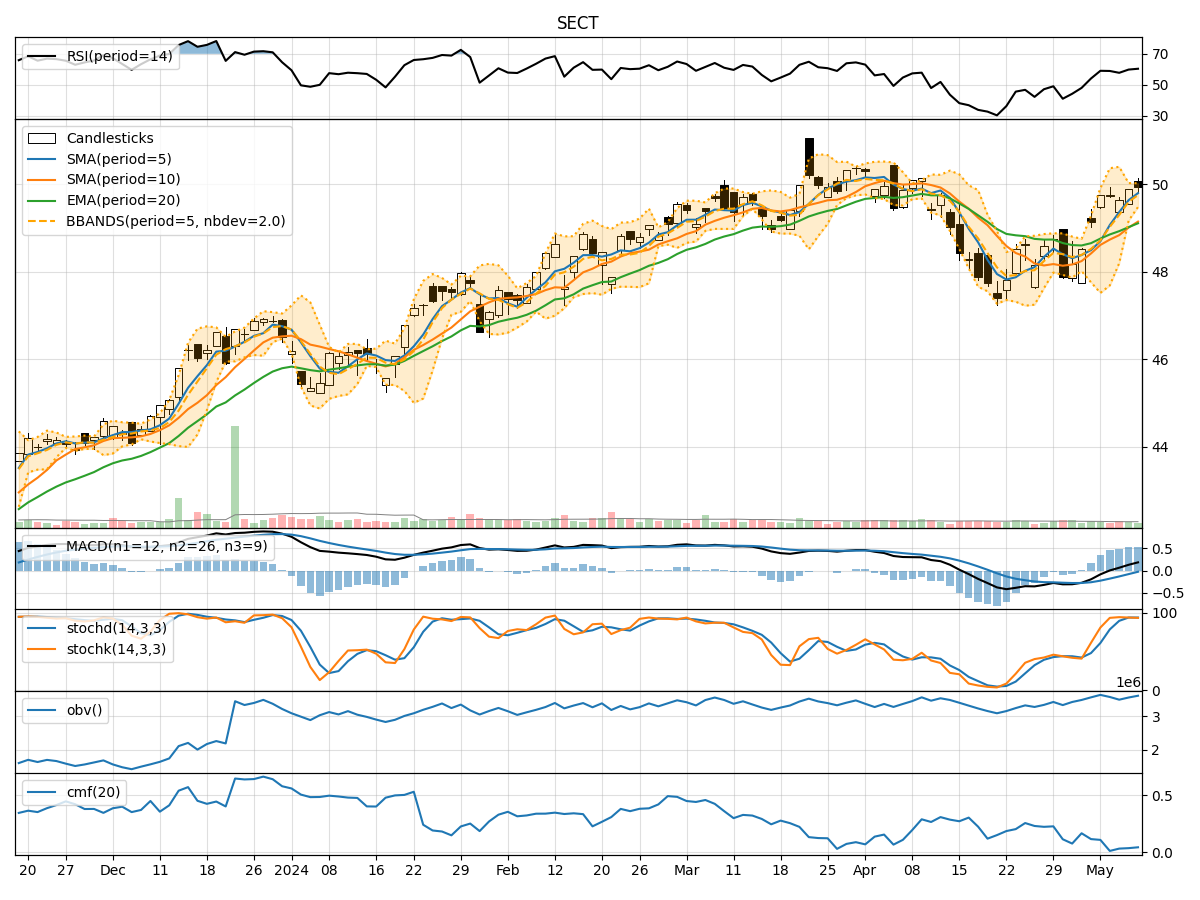
In analyzing the technical indicators for SECT over the last 5 days, we will delve into the trend, momentum, volatility, and volume indicators to provide a comprehensive outlook on the possible stock price movement in the coming days. By examining these key indicators, we aim to offer valuable insights and predictions to guide investment decisions.
Trend Indicators:
- Moving Averages (MA): The 5-day MA has been consistently above the closing prices, indicating a bullish trend.
- MACD: The MACD line has been consistently above the signal line, suggesting a bullish momentum.
- RSI: The RSI values have been fluctuating around the overbought territory, indicating strong buying pressure.
Momentum Indicators:
- Stochastic Oscillator: Both %K and %D values have been in the overbought zone, signaling a potential reversal.
- Williams %R: The indicator has been hovering in the oversold territory, suggesting a possible buying opportunity.
Volatility Indicators:
- Bollinger Bands: The bands have been narrowing, indicating decreasing volatility and a potential breakout.
- Average True Range (ATR): ATR values have been decreasing, suggesting a decrease in price volatility.
Volume Indicators:
- On-Balance Volume (OBV): The OBV has shown a slight increase, indicating accumulation by investors.
- Chaikin Money Flow (CMF): The CMF has been positive, suggesting buying pressure in the market.
Key Observations:
- The trend indicators point towards a bullish sentiment with moving averages and MACD signaling upward momentum.
- Momentum indicators show mixed signals with stochastic oscillator indicating overbought conditions and Williams %R suggesting a buying opportunity.
- Volatility indicators indicate a potential breakout as Bollinger Bands narrow, while ATR suggests decreasing volatility.
- Volume indicators show a slight increase in OBV and positive CMF, indicating buying pressure.
Conclusion:
Based on the analysis of the technical indicators, the stock price of SECT is likely to experience a continuation of the bullish trend in the coming days. However, caution is advised as some momentum indicators suggest overbought conditions, which could lead to a short-term correction. Traders should monitor the price action closely for potential entry or exit points, considering the mixed signals from momentum indicators. Overall, the outlook remains bullish with a potential for a short-term correction before resuming the upward trend.