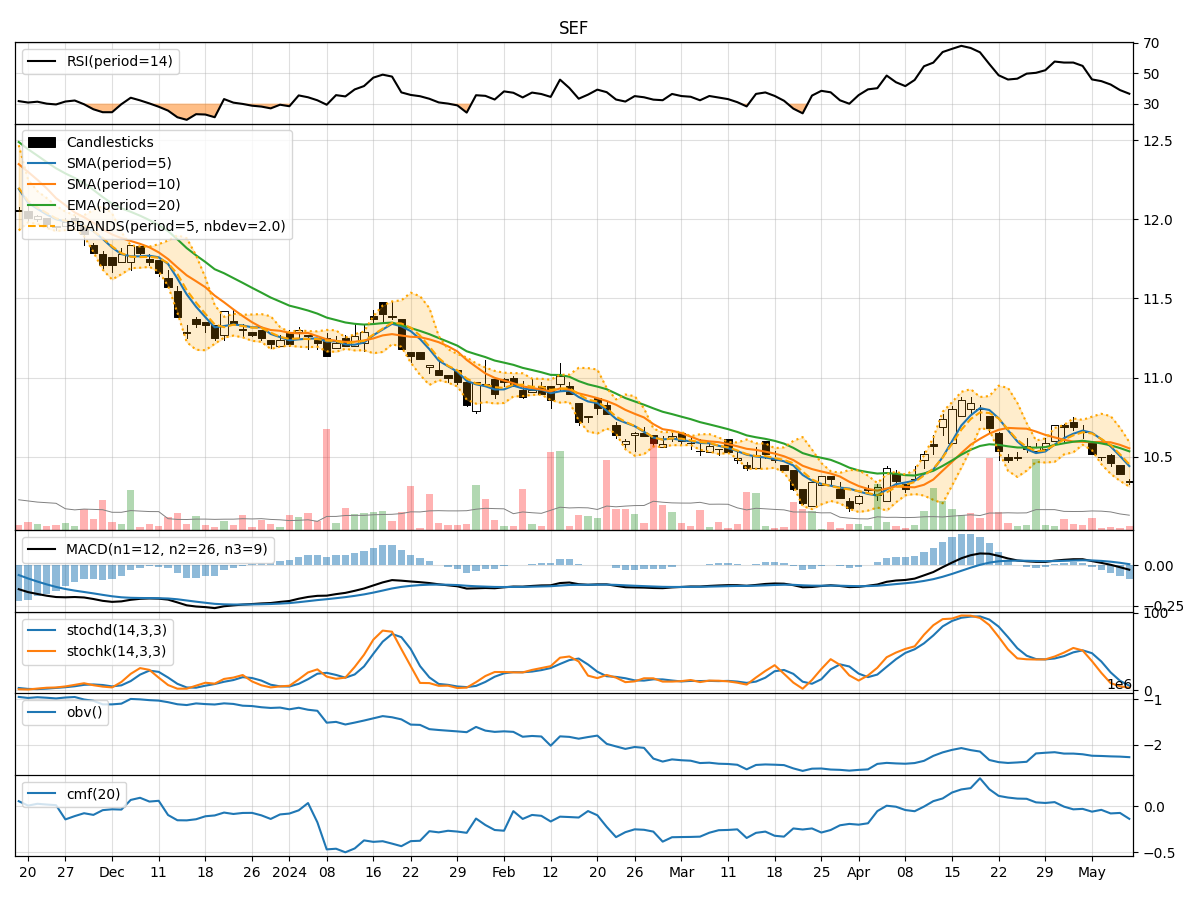
Technical Analysis of SEF 2024-05-10
Overview:
In the last 5 trading days, SEF stock has shown a downward trend in both price and volume. The moving averages (MA) have been declining, indicating a bearish trend. Momentum indicators like RSI and Stochastic Oscillator are also showing oversold conditions. Volatility indicators suggest a narrowing of the Bollinger Bands, indicating decreased price volatility. Volume indicators show a consistent decrease in On-Balance Volume (OBV) and Chaikin Money Flow (CMF), reflecting selling pressure.
Trend Analysis:
- Moving Averages (MA): The 5-day MA has been consistently below the longer-term SMAs and EMAs, indicating a bearish trend.
- MACD: The MACD line has been below the signal line, with decreasing values, suggesting a bearish momentum.
Momentum Analysis:
- RSI: The RSI has been decreasing and is now in the oversold territory, indicating a potential reversal or consolidation.
- Stochastic Oscillator: Both %K and %D are at very low levels, signaling oversold conditions.
Volatility Analysis:
- Bollinger Bands (BB): The bands are narrowing, indicating decreasing price volatility and a potential upcoming breakout.
Volume Analysis:
- On-Balance Volume (OBV): The OBV has been consistently decreasing, showing a divergence between price and volume, which is a bearish sign.
- Chaikin Money Flow (CMF): The CMF has been negative, indicating selling pressure in the stock.
Key Observations:
- The stock is currently in a downtrend based on moving averages and MACD.
- Momentum indicators suggest the stock is oversold and may see a potential reversal or consolidation.
- Volatility is decreasing, indicating a possible period of consolidation before a breakout.
- Volume indicators show selling pressure with decreasing OBV and negative CMF.
Conclusion:
Based on the technical analysis of the trend, momentum, volatility, and volume indicators, the next few days' possible stock price movement for SEF is likely to be sideways to slightly bullish. The oversold conditions in momentum indicators and decreasing volatility suggest a potential consolidation phase before a possible reversal or breakout. However, the overall trend remains bearish, so any upside movement may be limited. Traders should watch for signs of a trend reversal or confirmation of a breakout before considering long positions.