Technical Analysis of SEIQ 2024-05-10
Overview:
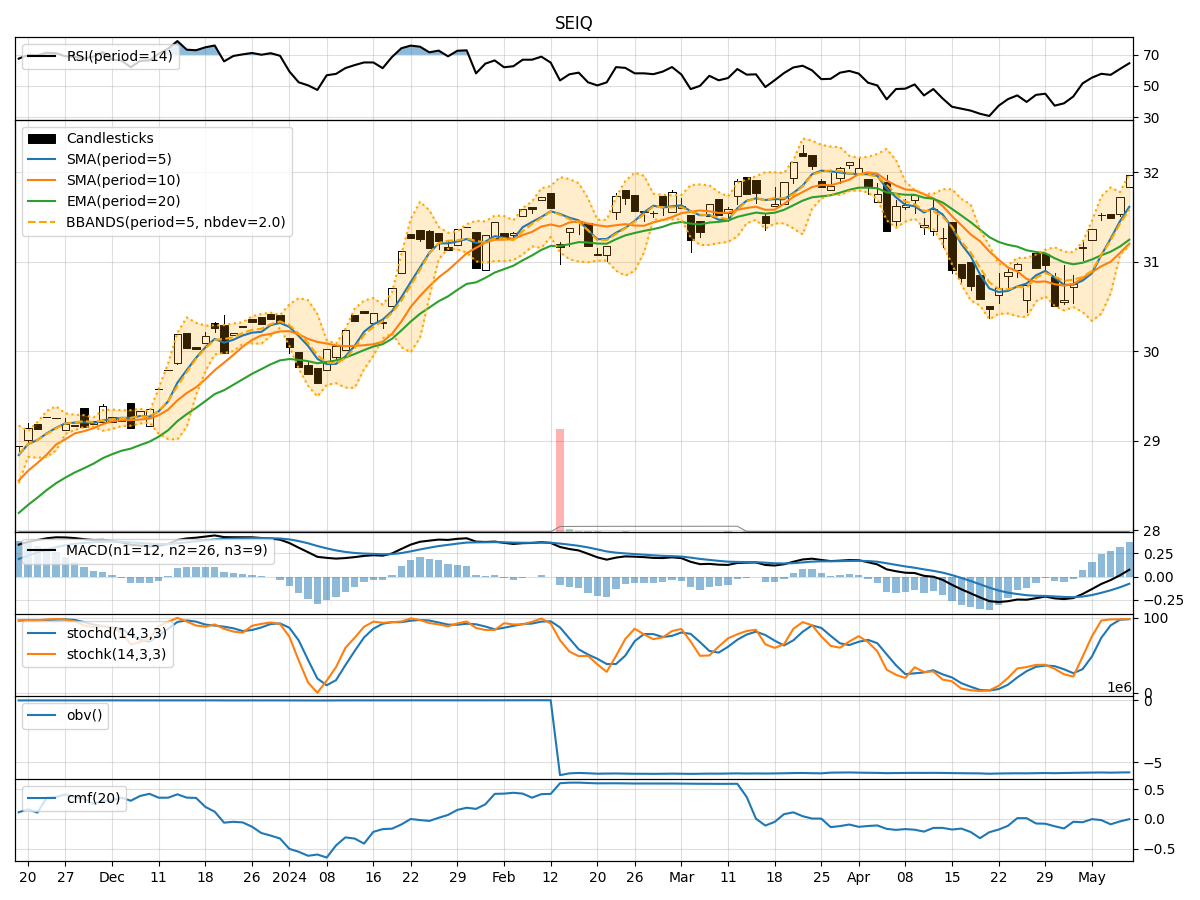
In analyzing the technical indicators for SEIQ over the last 5 days, we will delve into the trend, momentum, volatility, and volume indicators to provide a comprehensive outlook on the possible stock price movement in the coming days. By examining these key indicators, we aim to offer valuable insights and predictions for potential investors.
Trend Indicators:
- Moving Averages (MA): The 5-day Moving Average has been consistently rising, indicating a bullish trend in the short term.
- MACD: The MACD line has been increasing, showing positive momentum in the stock price.
- MACD Histogram: The MACD Histogram has been consistently positive, suggesting a strengthening bullish momentum.
Momentum Indicators:
- RSI: The Relative Strength Index has been increasing, indicating growing buying pressure and potential overbought conditions.
- Stochastic Oscillator: Both %K and %D have been in the overbought zone, signaling a potential reversal or consolidation.
- Williams %R: The Williams %R is at extreme levels, suggesting a possible pullback in the stock price.
Volatility Indicators:
- Bollinger Bands: The stock price has been trading near the upper Bollinger Band, indicating high volatility and a potential overbought condition.
- Bollinger %B: The %B indicator is above 0.8, signaling a potential overbought scenario.
- Bollinger Band Width: The Band Width has been expanding, indicating increased volatility in the stock price.
Volume Indicators:
- On-Balance Volume (OBV): The OBV has been fluctuating but generally showing a slight decrease, suggesting some distribution in the stock.
- Chaikin Money Flow (CMF): The CMF has been negative, indicating selling pressure in the stock.
Key Observations and Opinions:
- Trend: The stock is in an upward trend based on moving averages and MACD analysis.
- Momentum: Momentum indicators suggest the stock is overbought and may experience a pullback.
- Volatility: High volatility and overbought conditions are indicated by Bollinger Bands and %B.
- Volume: The OBV and CMF indicate some selling pressure in the stock.
Conclusion:
Based on the analysis of the technical indicators, the next few days may see a potential pullback or consolidation in the stock price of SEIQ. Investors should exercise caution as the stock is showing signs of being overbought and experiencing selling pressure. It is advisable to wait for a better entry point or consider taking profits if already invested.