Technical Analysis of SEIV 2024-05-10
Overview:
In analyzing the technical indicators for SEIV stock over the last 5 days, we will delve into the trend, momentum, volatility, and volume indicators to provide a comprehensive outlook on the possible stock price movement in the coming days. By examining these key indicators, we aim to offer valuable insights and predictions to guide your investment decisions.
Trend Indicators:
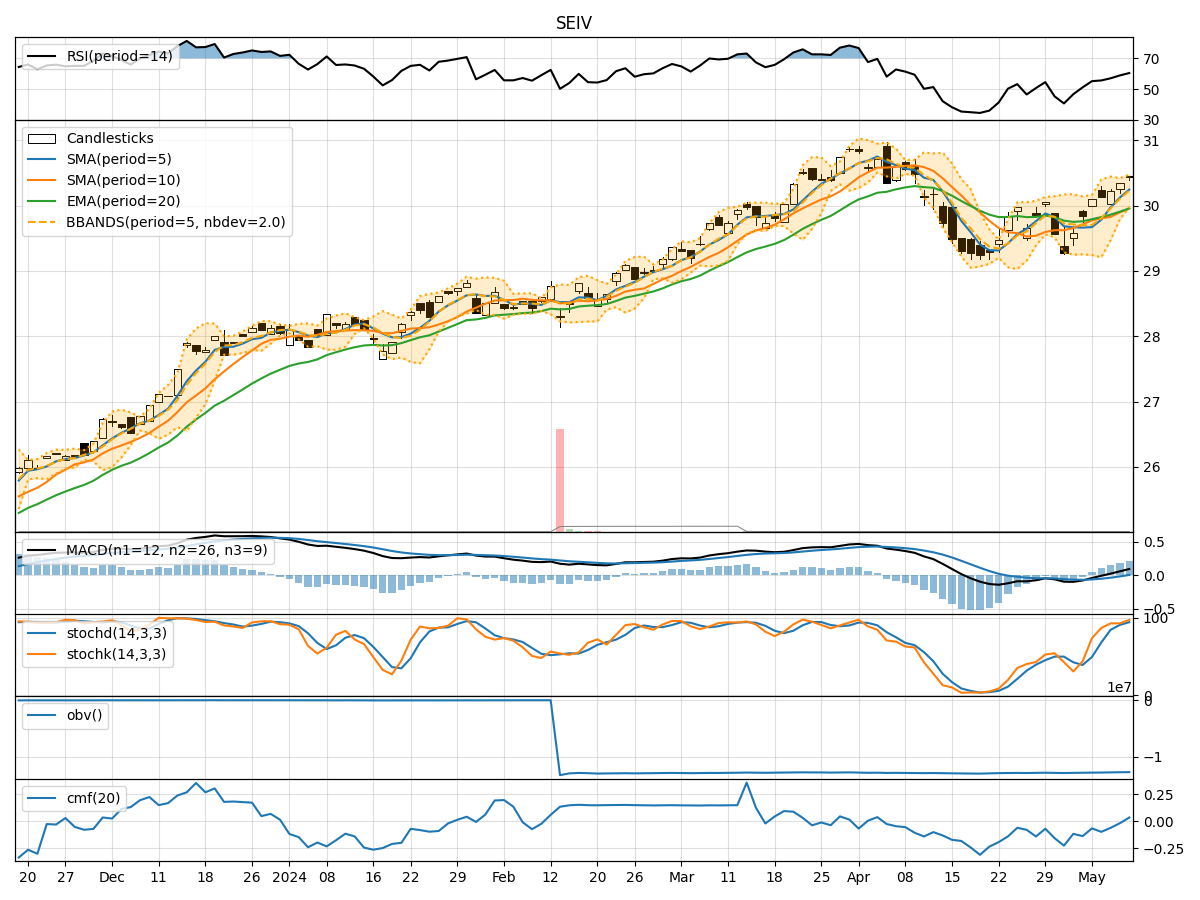
- Moving Averages (MA): The 5-day MA has been consistently above the closing prices, indicating a short-term uptrend.
- MACD: The MACD line has been trending upwards, crossing above the signal line, suggesting bullish momentum.
- RSI: The RSI has been increasing, indicating strengthening bullish momentum.
Momentum Indicators:
- Stochastic Oscillator: Both %K and %D have been in overbought territory, suggesting a potential reversal or consolidation.
- Williams %R: The indicator has been fluctuating around oversold levels, indicating potential buying opportunities.
Volatility Indicators:
- Bollinger Bands: The stock price has been trading within the bands, with the bands narrowing, indicating decreasing volatility.
- Average True Range (ATR): ATR has been relatively stable, suggesting a lack of significant price fluctuations.
Volume Indicators:
- On-Balance Volume (OBV): The OBV has been declining, indicating selling pressure.
- Chaikin Money Flow (CMF): The CMF has been negative, suggesting outflow of money from the stock.
Key Observations and Opinions:
- Trend: The stock is in a short-term uptrend based on moving averages and MACD.
- Momentum: Stochastic Oscillator and Williams %R indicate potential overbought conditions and a need for caution.
- Volatility: Bollinger Bands narrowing suggest a period of consolidation or a potential breakout.
- Volume: Declining OBV and negative CMF indicate bearish sentiment and potential further downside.
Conclusion:
Based on the analysis of the technical indicators, the next few days for SEIV stock are likely to see sideways movement or a slight pullback. The overbought conditions indicated by momentum indicators and the negative volume indicators suggest a possible correction or consolidation phase. Traders should exercise caution and consider waiting for clearer signals before making significant trading decisions.