Technical Analysis of SEMI 2024-05-10
Overview:
In analyzing the technical indicators for SEMI stock over the last 5 days, we will delve into the trend, momentum, volatility, and volume indicators to provide a comprehensive outlook on the possible stock price movement in the coming days. By examining these key indicators, we aim to offer valuable insights and recommendations for potential investors.
Trend Analysis:
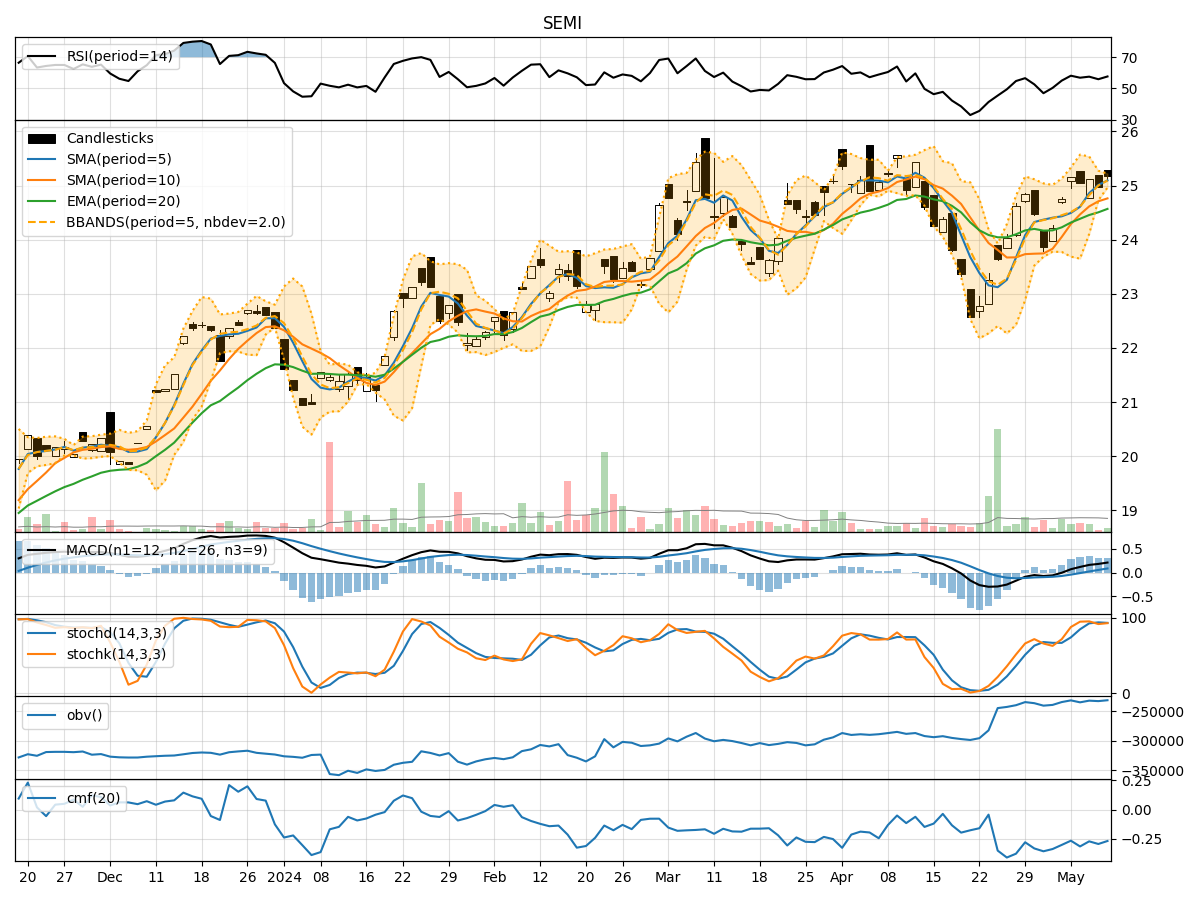
- Moving Averages (MA): The 5-day Moving Average (MA) has been consistently above the Simple Moving Average (SMA) and Exponential Moving Average (EMA), indicating a bullish trend.
- MACD: The MACD line has been consistently above the signal line, suggesting a bullish momentum in the stock price.
Key Observation: The trend indicators point towards an upward trend in the stock price.
Momentum Analysis:
- RSI: The Relative Strength Index (RSI) has been fluctuating around the 50 level, indicating a neutral momentum in the stock.
- Stochastic Oscillator: Both %K and %D lines of the Stochastic Oscillator have been hovering around the overbought zone, suggesting a potential reversal in momentum.
Key Observation: The momentum indicators suggest a neutral to slightly bearish sentiment in the stock.
Volatility Analysis:
- Bollinger Bands (BB): The stock price has been trading within the Bollinger Bands, with the bands narrowing, indicating decreasing volatility.
Key Observation: Volatility is decreasing, which may lead to a period of consolidation or a potential breakout.
Volume Analysis:
- On-Balance Volume (OBV): The OBV has been relatively stable over the last 5 days, indicating a balance between buying and selling pressure.
- Chaikin Money Flow (CMF): The CMF has been negative, suggesting a net outflow of money from the stock.
Key Observation: The volume indicators reflect a neutral sentiment in terms of buying and selling pressure.
Conclusion:
Based on the analysis of the technical indicators, the stock is currently in an upward trend with decreasing volatility. However, the momentum indicators suggest a neutral to slightly bearish sentiment. The volume indicators also indicate a neutral stance.
Forecast:
Considering the overall analysis, the stock price of SEMI is likely to experience consolidation in the coming days, with a potential for a slight pullback due to the neutral momentum. Investors should closely monitor the price action within the narrowing Bollinger Bands for a potential breakout direction.
Key Recommendations:
- Hold Strategy: Existing investors may consider holding their positions during the consolidation phase.
- Entry Points: Potential investors could look for entry points near the lower Bollinger Band for a favorable risk-reward ratio.
- Risk Management: Implement stop-loss orders to manage downside risk in case of a breakout in either direction.
Disclaimer:
This analysis is based solely on technical indicators and historical data. It is essential to conduct thorough research and consider fundamental factors before making investment decisions. Consulting with a financial advisor is recommended to align investment strategies with individual risk tolerance and financial goals.