Technical Analysis of SEPT 2024-05-10
Overview:
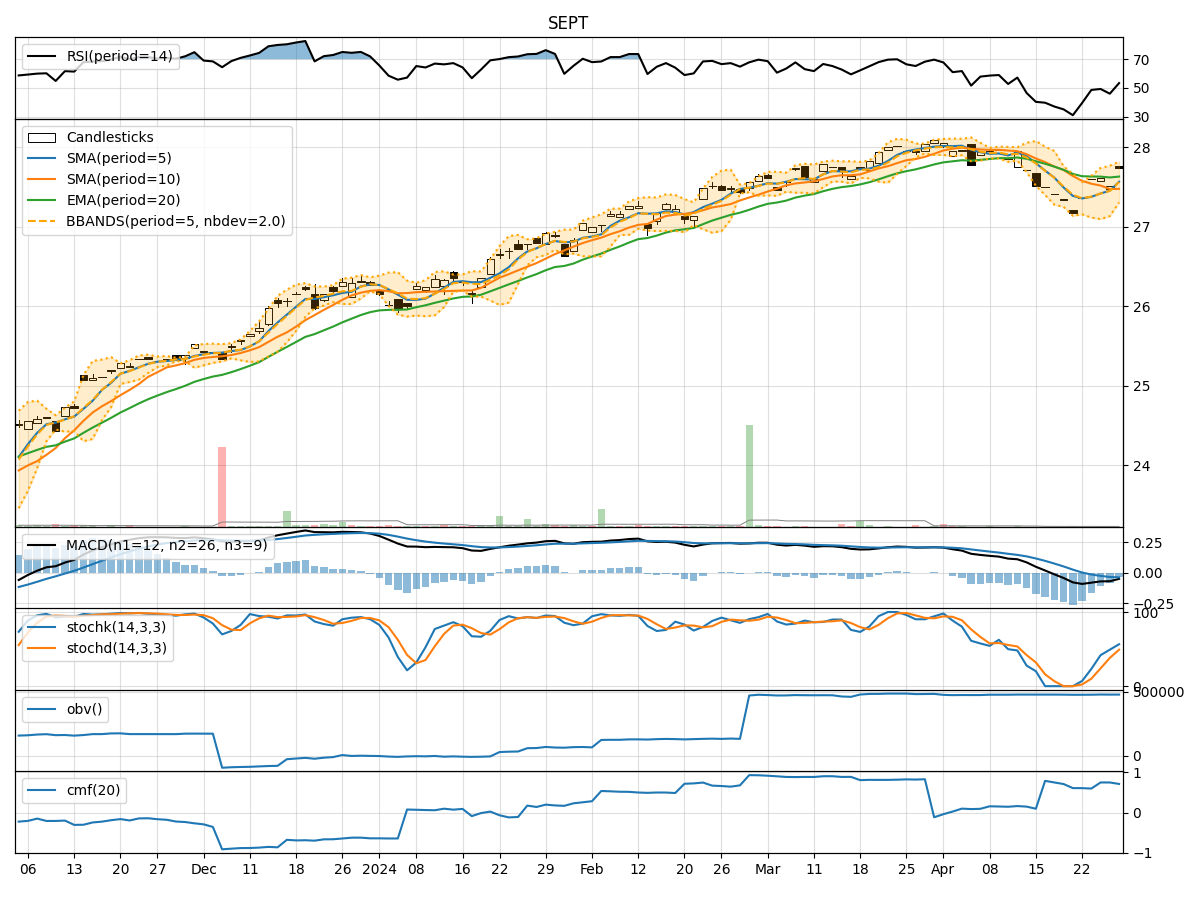
In analyzing the technical indicators for SEPT stock over the last 5 days, we will delve into the trend, momentum, volatility, and volume indicators to provide a comprehensive outlook on the possible stock price movement in the upcoming days.
Trend Analysis:
- Moving Averages (MA): The 5-day Moving Average (MA) has been consistently above the Simple Moving Average (SMA) and Exponential Moving Average (EMA), indicating a bullish trend.
- MACD: The MACD line has been consistently above the signal line, with both lines showing an upward trend, suggesting bullish momentum.
Momentum Analysis:
- RSI: The Relative Strength Index (RSI) has been gradually increasing and is currently in the overbought territory, indicating strong buying momentum.
- Stochastic Oscillator: Both %K and %D lines of the Stochastic Oscillator are at 100%, signaling an overbought condition.
Volatility Analysis:
- Bollinger Bands (BB): The stock price has been trading within the upper Bollinger Band (BBU), indicating high volatility.
Volume Analysis:
- On-Balance Volume (OBV): The OBV has been relatively stable, suggesting consistent buying pressure.
- Chaikin Money Flow (CMF): The CMF has been positive, indicating money flow into the stock.
Key Observations:
- The stock is in a strong bullish trend based on moving averages and MACD.
- Momentum indicators like RSI and Stochastic Oscillator suggest an overbought condition.
- Volatility remains high as the stock price is near the upper Bollinger Band.
- Volume indicators show consistent buying pressure.
Conclusion:
Based on the technical analysis of the trend, momentum, volatility, and volume indicators, the stock is likely to experience a short-term pullback or consolidation in the upcoming days due to the overbought conditions indicated by the momentum indicators. Traders may consider taking profits or waiting for a better entry point before considering long positions. However, the overall trend remains bullish, so any pullback could present a buying opportunity for investors with a longer-term horizon.