Technical Analysis of SEPW 2024-05-10
Overview:
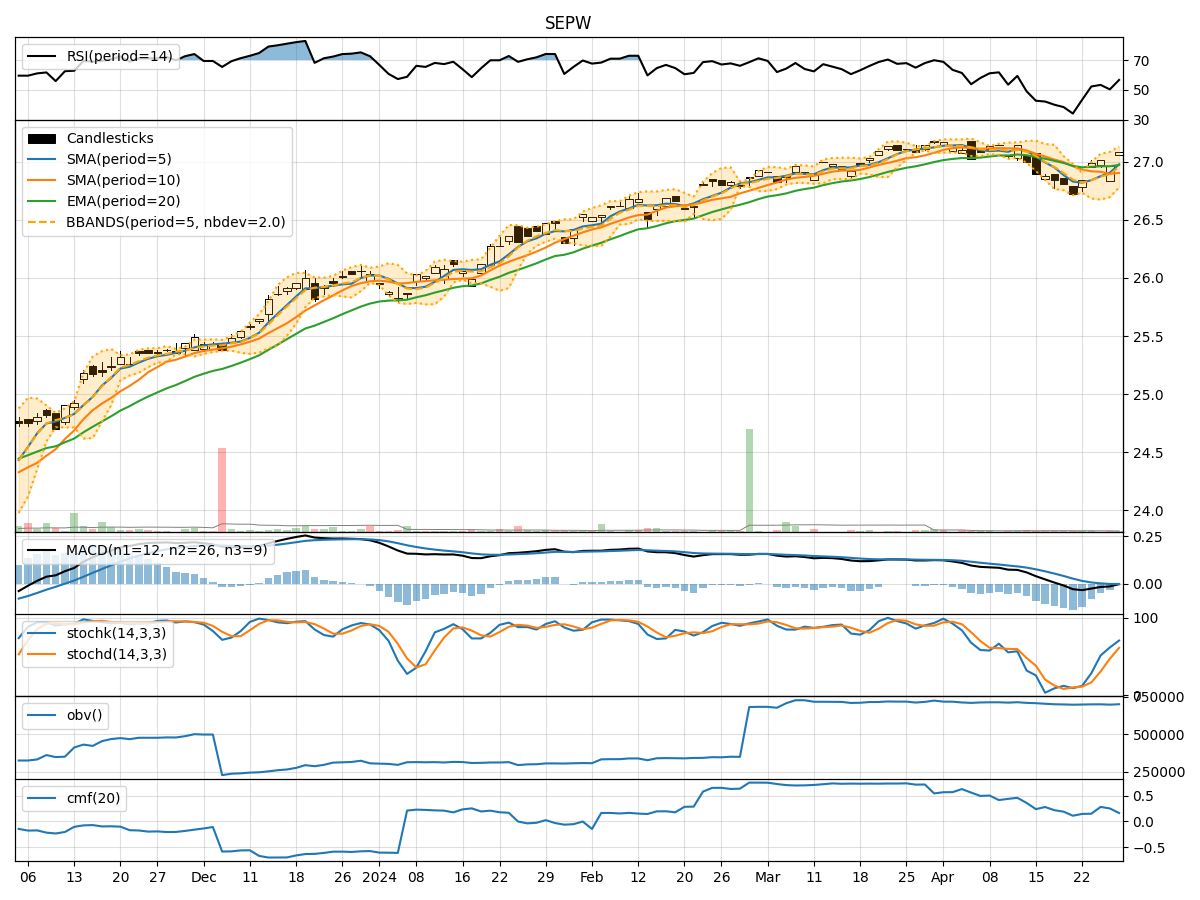
In analyzing the technical indicators for SEPW over the last 5 days, we will delve into the trend, momentum, volatility, and volume indicators to provide a comprehensive outlook on the possible stock price movement in the coming days.
Trend Indicators:
- Moving Averages (MA): The 5-day Moving Average has been consistently above the Simple Moving Average (SMA) and Exponential Moving Average (EMA), indicating a bullish trend.
- MACD: The MACD line has been consistently above the signal line, with both lines showing an upward trend, suggesting bullish momentum.
- MACD Histogram: The MACD Histogram has been increasing, indicating strengthening bullish momentum.
Momentum Indicators:
- RSI: The Relative Strength Index (RSI) has been gradually increasing and is currently in the overbought territory, suggesting a strong bullish momentum.
- Stochastic Oscillator: Both %K and %D lines of the Stochastic Oscillator have been at 100%, indicating strong upward momentum.
- Williams %R: The Williams %R is at 0, signaling an overbought condition.
Volatility Indicators:
- Bollinger Bands: The stock price has been consistently trading above the middle Bollinger Band (BBM), indicating an upward trend.
- Bollinger %B: The %B indicator has been above 0.5, suggesting bullish momentum.
Volume Indicators:
- On-Balance Volume (OBV): The OBV has been relatively stable, indicating consistent buying pressure.
- Chaikin Money Flow (CMF): The CMF has been positive and increasing, indicating strong buying pressure.
Key Observations and Opinions:
- Trend: The trend indicators suggest a strong bullish trend in the stock.
- Momentum: Momentum indicators confirm the bullish sentiment with overbought conditions.
- Volatility: Volatility indicators show a stable uptrend with bullish momentum.
- Volume: Volume indicators support the bullish outlook with consistent buying pressure.
Conclusion:
Based on the analysis of the technical indicators, the next few days' possible stock price movement for SEPW is likely to continue in an upward direction. The bullish trend, strong momentum, stable volatility, and consistent buying pressure all point towards further price appreciation. Traders and investors may consider buying or holding positions in SEPW for potential gains in the coming days.