Technical Analysis of SEPZ 2024-05-10
Overview:
In analyzing the technical indicators for SEPZ over the last 5 days, we will delve into the trend, momentum, volatility, and volume indicators to provide a comprehensive outlook on the possible stock price movement in the coming days. By examining these key aspects, we aim to offer valuable insights and predictions for potential investors.
Trend Analysis:
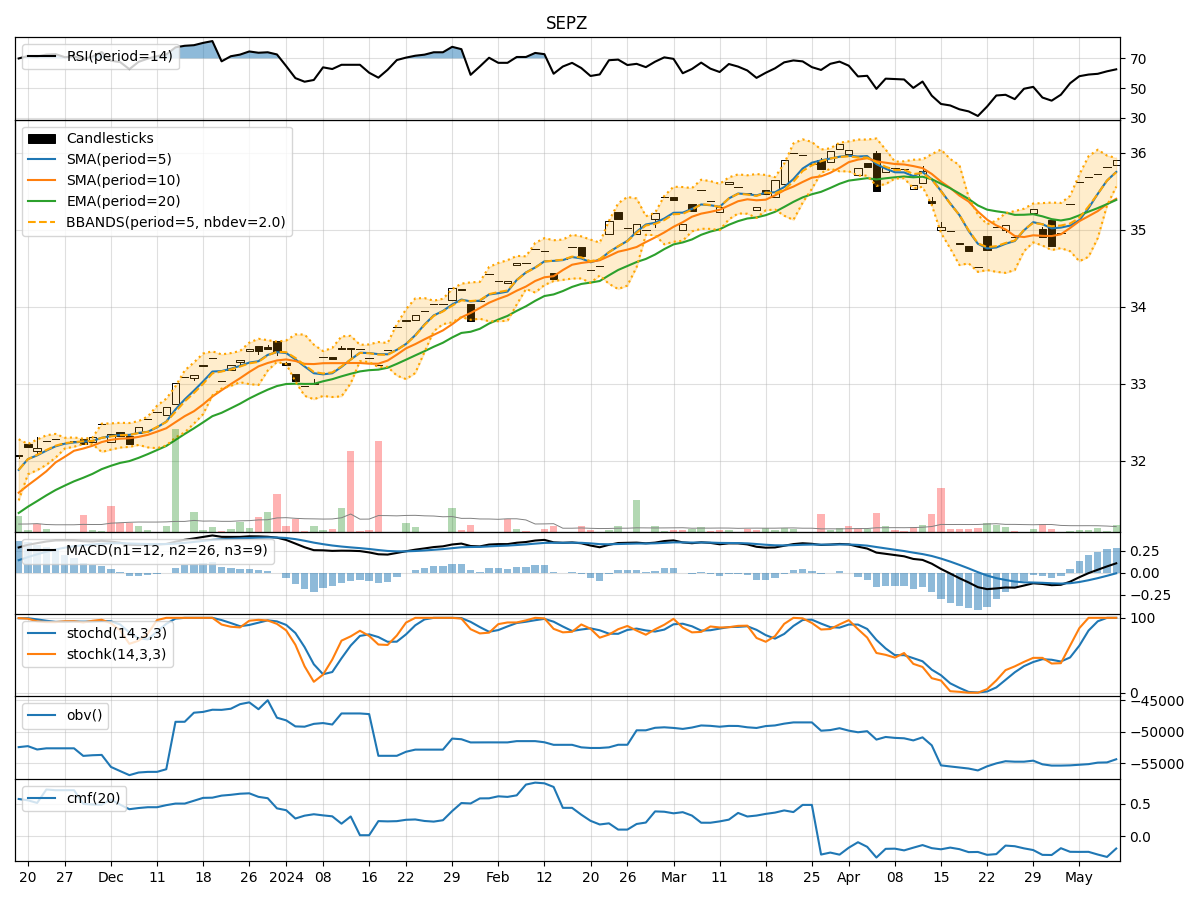
- Moving Averages (MA): The 5-day MA has been consistently above the closing prices, indicating a short-term uptrend.
- MACD: The MACD line has been positive and increasing, suggesting bullish momentum.
- EMA: The EMA has been trending upwards, supporting the bullish sentiment.
Key Observation: The trend indicators point towards an upward trend in the stock price.
Momentum Analysis:
- RSI: The RSI has been increasing and is in the overbought territory, signaling strong buying momentum.
- Stochastic Oscillator: Both %K and %D have been at 100%, indicating strong bullish momentum.
- Williams %R: The indicator has consistently been at 0, reflecting a strong bullish sentiment.
Key Observation: Momentum indicators suggest a strong bullish momentum in the stock.
Volatility Analysis:
- Bollinger Bands (BB): The stock price has been trading within the bands, with the %B indicating a slight deviation from the upper band.
- Volatility: The volatility has been relatively stable over the last 5 days.
Key Observation: Volatility indicators show a stable trading environment with a slight deviation from the upper Bollinger Band.
Volume Analysis:
- On-Balance Volume (OBV): The OBV has been fluctuating but overall showing a slight decrease.
- Chaikin Money Flow (CMF): The CMF has been negative, indicating selling pressure.
Key Observation: Volume indicators suggest a slight bearish sentiment due to the negative CMF and decreasing OBV.
Conclusion:
Based on the analysis of trend, momentum, volatility, and volume indicators, the overall outlook for SEPZ in the next few days is bullish. The strong uptrend indicated by moving averages and MACD, coupled with robust momentum signals from RSI and Stochastic Oscillator, support a bullish view. Although there is a slight deviation from the upper Bollinger Band, the overall stable volatility and bearish volume sentiment may pose some challenges. However, the bullish trend and momentum indicators outweigh these factors, indicating a potential upward movement in the stock price in the coming days.
Recommendation:
Considering the comprehensive analysis of technical indicators, investors may consider buying or holding positions in SEPZ for potential gains in the short term. It is essential to monitor the price action closely and set appropriate stop-loss levels to manage risks effectively.