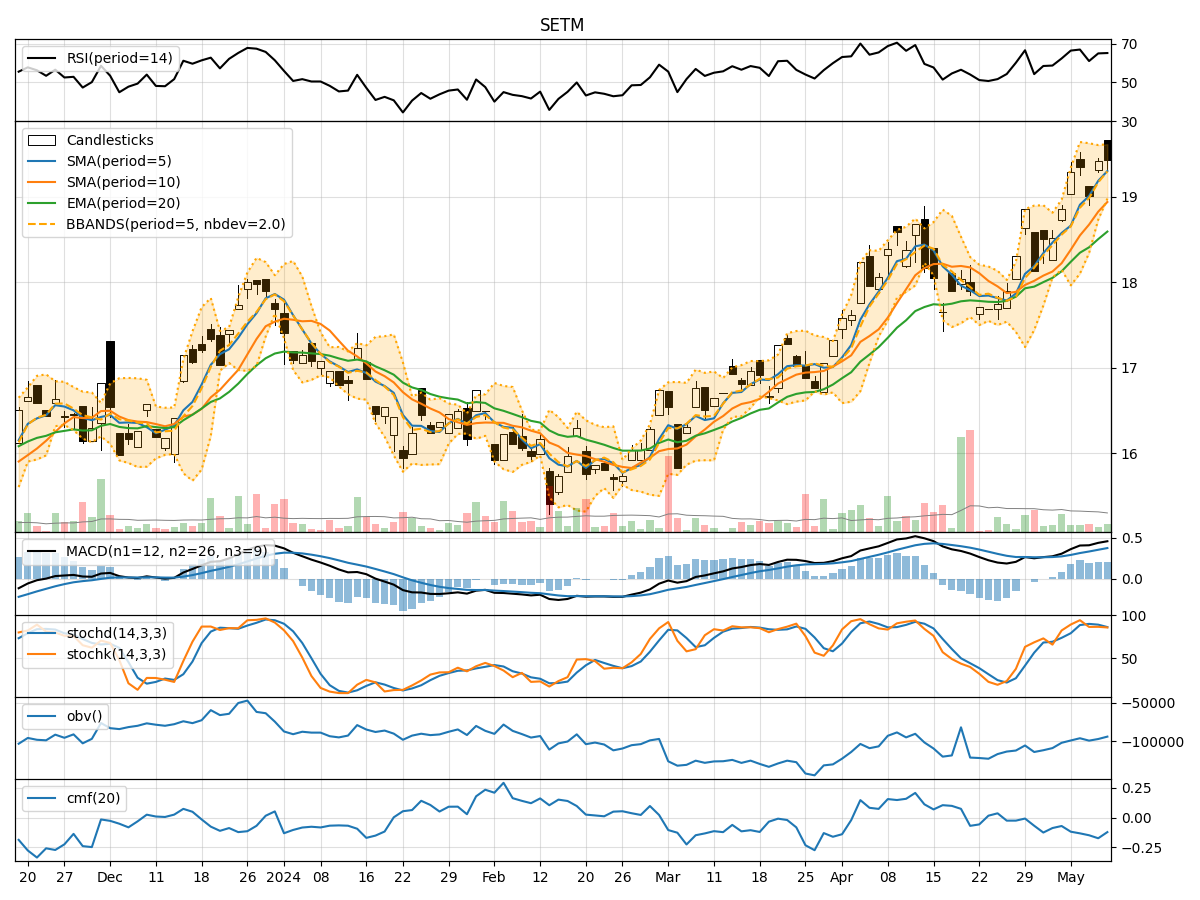
Technical Analysis of SETM 2024-05-10
Overview:
In analyzing the technical indicators for SETM over the last 5 days, we will delve into the trend, momentum, volatility, and volume indicators to provide a comprehensive outlook on the possible stock price movement in the coming days.
Trend Indicators:
- Moving Averages (MA): The 5-day Moving Average has been consistently above the Simple Moving Average (SMA) and Exponential Moving Average (EMA), indicating a bullish trend.
- MACD: The MACD line has been consistently above the signal line, with both lines showing an upward trend, suggesting bullish momentum.
- MACD Histogram: The MACD Histogram has been positive and increasing, further supporting the bullish sentiment.
Momentum Indicators:
- RSI: The Relative Strength Index (RSI) has been in the overbought territory but has not shown extreme levels, indicating potential for further upside.
- Stochastic Oscillator: Both %K and %D lines of the Stochastic Oscillator have been relatively high, suggesting strong buying momentum.
- Williams %R: The Williams %R is in the oversold region, indicating a potential reversal to the upside.
Volatility Indicators:
- Bollinger Bands: The stock price has been trading within the Bollinger Bands, with the bands narrowing, indicating decreasing volatility.
- Bollinger %B: The %B indicator is above 0.5, suggesting that the stock price is trading closer to the upper band.
Volume Indicators:
- On-Balance Volume (OBV): The OBV has shown mixed signals, with some days experiencing selling pressure and others showing accumulation.
- Chaikin Money Flow (CMF): The CMF has been negative, indicating a lack of buying pressure in the stock.
Key Observations and Opinions:
- Trend: The trend indicators suggest a strong bullish sentiment in the stock.
- Momentum: Momentum indicators indicate a continuation of buying pressure, albeit with some overbought conditions.
- Volatility: Volatility has been decreasing, potentially signaling a period of consolidation.
- Volume: Volume indicators show mixed signals, with no clear accumulation or distribution pattern.
Conclusion:
Based on the analysis of the technical indicators, the stock is likely to continue its upward movement in the coming days. The bullish trend, supported by positive momentum and decreasing volatility, indicates a favorable outlook for SETM. However, investors should closely monitor the overbought conditions in some momentum indicators and the mixed signals in volume indicators for any potential reversals or corrections. Overall, the technical analysis suggests a bullish view for the next few days.