Technical Analysis of SFIG 2024-05-10
Overview:
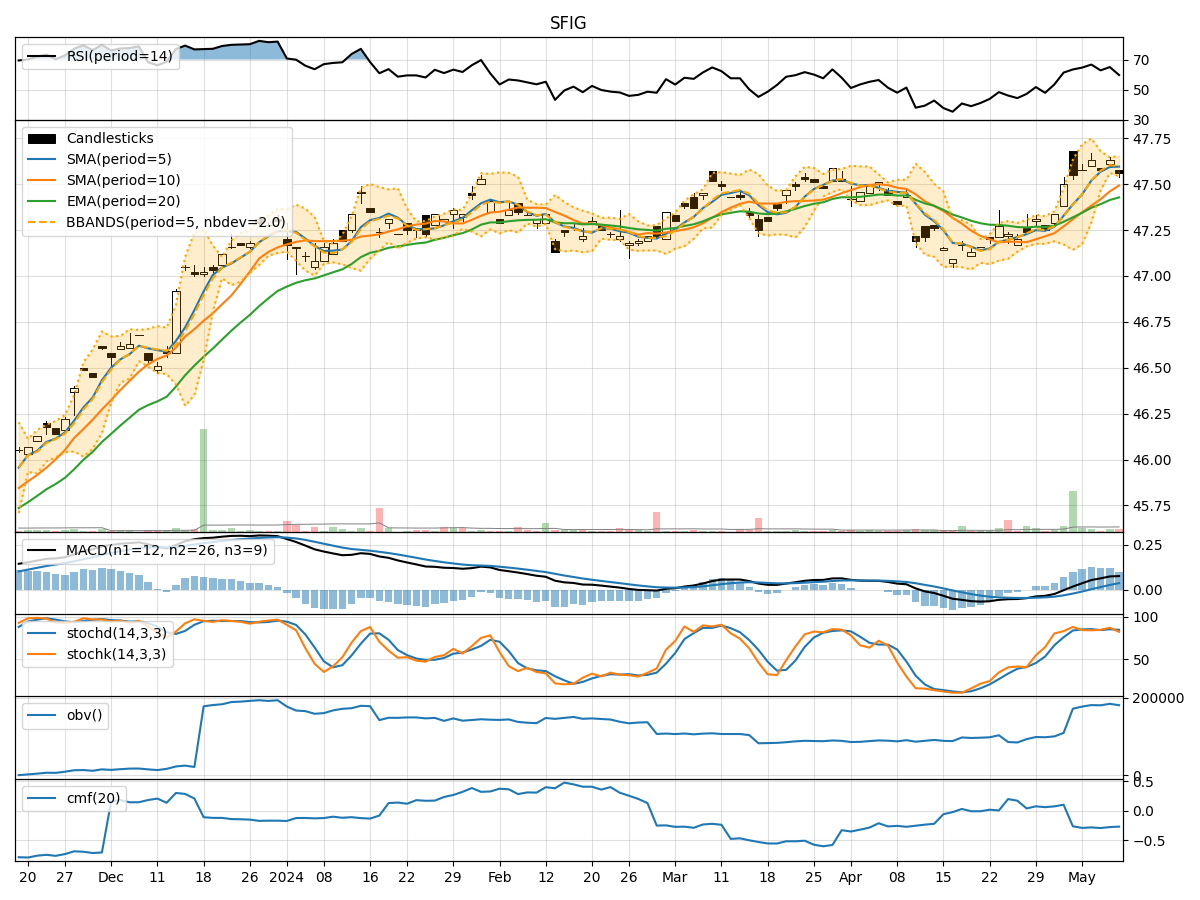
In analyzing the technical indicators for SFIG stock over the last 5 days, we will delve into the trends, momentum, volatility, and volume aspects to provide a comprehensive outlook on the possible stock price movement in the coming days. By examining key indicators such as moving averages, MACD, RSI, Stochastic Oscillator, Bollinger Bands, and OBV, we aim to offer valuable insights and predictions for potential price action.
Trend Analysis:
- Moving Averages (MA): The 5-day MA has been consistently above the closing prices, indicating a short-term uptrend.
- MACD: The MACD line has been trending upwards, with the MACD histogram showing positive values, suggesting bullish momentum.
- EMA: The EMA has been steadily increasing, supporting the bullish trend.
Momentum Analysis:
- RSI: The RSI has been in the overbought territory, indicating strong buying momentum.
- Stochastic Oscillator: Both %K and %D have been relatively high, signaling bullish momentum.
- Williams %R (Willr): The indicator has been in the oversold region, suggesting a potential reversal.
Volatility Analysis:
- Bollinger Bands (BB): The bands have been narrowing, indicating decreasing volatility.
- BB %B: The %B indicator has been fluctuating within a narrow range, reflecting consolidation.
Volume Analysis:
- On-Balance Volume (OBV): The OBV has shown mixed movements, suggesting indecision among investors.
- Chaikin Money Flow (CMF): The CMF has been negative, indicating selling pressure.
Key Observations:
- The stock has exhibited a bullish trend based on moving averages and MACD.
- Momentum indicators like RSI and Stochastic Oscillator suggest strong buying pressure.
- Volatility has been decreasing, potentially leading to a period of consolidation.
- Volume indicators show mixed signals, with OBV indicating some selling pressure.
Conclusion:
Based on the analysis of technical indicators, the stock is likely to continue its upward momentum in the short term. However, given the overbought conditions in RSI and the potential reversal signal in Williams %R, we may see a brief consolidation or a minor pullback before the uptrend resumes. Traders should monitor key support levels and consider taking profits on long positions. Overall, the outlook remains bullish with a possibility of a short-term correction.