Technical Analysis of SFLO 2024-05-10
Overview:
In analyzing the technical indicators for SFLO stock over the last 5 days, we will delve into the trend, momentum, volatility, and volume indicators to provide a comprehensive outlook on the possible stock price movement in the coming days. By examining these key indicators, we aim to offer valuable insights and predictions for potential investors.
Trend Analysis:
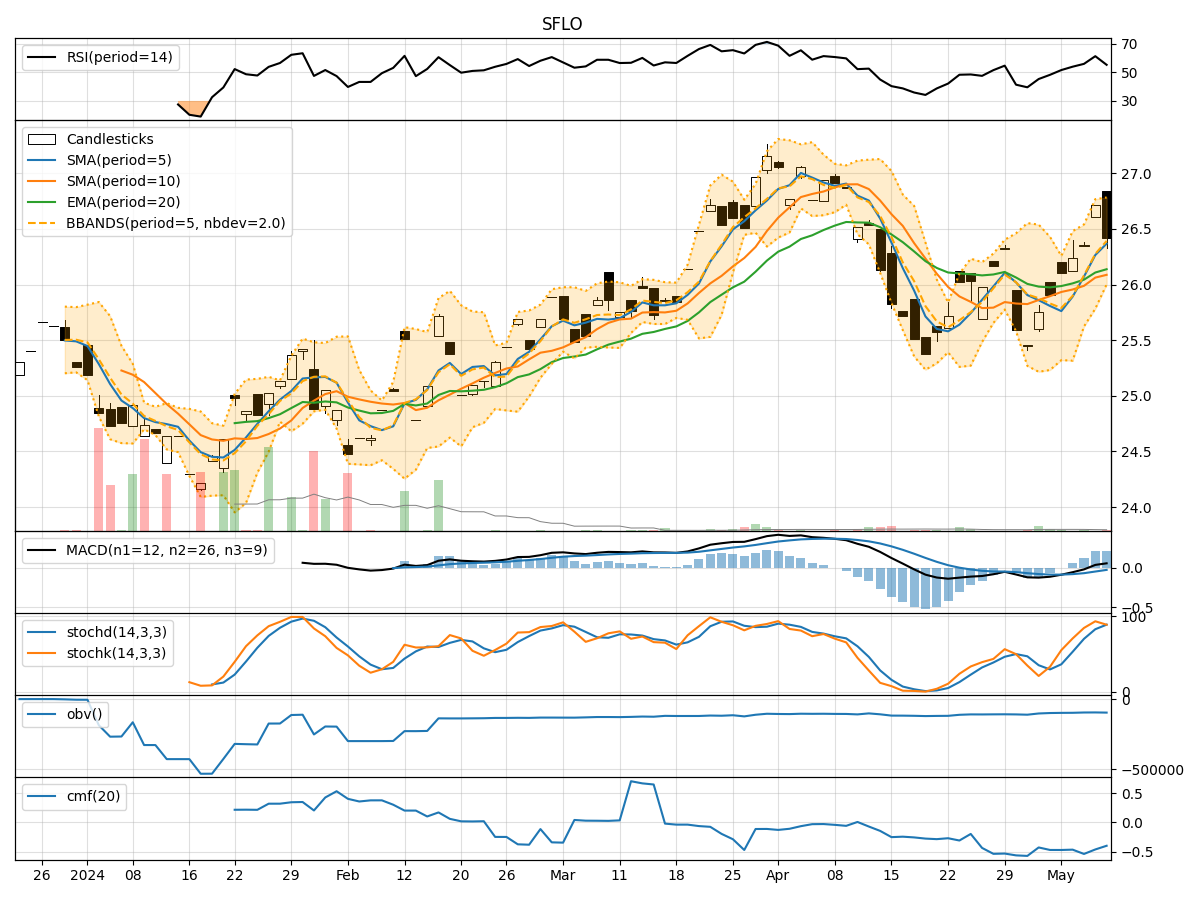
- Moving Averages (MA): The 5-day Moving Average (MA) has been trending above the Simple Moving Average (SMA) and Exponential Moving Average (EMA), indicating a short-term bullish trend.
- MACD: The Moving Average Convergence Divergence (MACD) has shown positive values, with the MACD line consistently above the Signal line, suggesting bullish momentum.
- RSI: The Relative Strength Index (RSI) has been fluctuating around the 50 level, indicating a neutral stance in terms of overbought or oversold conditions.
Momentum Analysis:
- Stochastic Oscillator: The Stochastic Oscillator has been in the overbought territory, suggesting a strong bullish momentum in the recent trading days.
- Williams %R: The Williams %R indicator has been in the oversold region, indicating a potential reversal or correction in the stock price.
Volatility Analysis:
- Bollinger Bands: The Bollinger Bands have shown a narrowing of the bands, indicating decreasing volatility in the stock price.
- Average True Range (ATR): The ATR values have been relatively stable, suggesting consistent price movements without significant spikes in volatility.
Volume Analysis:
- On-Balance Volume (OBV): The OBV indicator has shown mixed signals, with slight fluctuations in volume accumulation/distribution.
- Chaikin Money Flow (CMF): The CMF has been negative, indicating a bearish pressure on the stock price.
Key Observations:
- The trend indicators suggest a bullish sentiment in the short term.
- Momentum indicators point towards a strong bullish momentum but with signs of potential reversal.
- Volatility indicators indicate decreasing volatility in the stock price.
- Volume indicators show mixed signals with a slight bearish bias.
Conclusion:
Based on the analysis of the technical indicators, the next few days' possible stock price movement for SFLO is likely to continue in an upward direction with some potential for consolidation or a minor correction due to the overbought conditions indicated by the momentum indicators. Investors should closely monitor the price action and key support/resistance levels for potential entry or exit points. Overall, the outlook remains bullish but with a cautious approach towards managing risks associated with the current market dynamics.