Technical Analysis of SFYX 2024-05-10
Overview:
In analyzing the technical indicators for SFYX over the last 5 days, we will delve into the trend, momentum, volatility, and volume indicators to provide a comprehensive outlook on the possible stock price movement in the coming days. By examining these key aspects, we aim to offer valuable insights and predictions to guide investment decisions.
Trend Analysis:
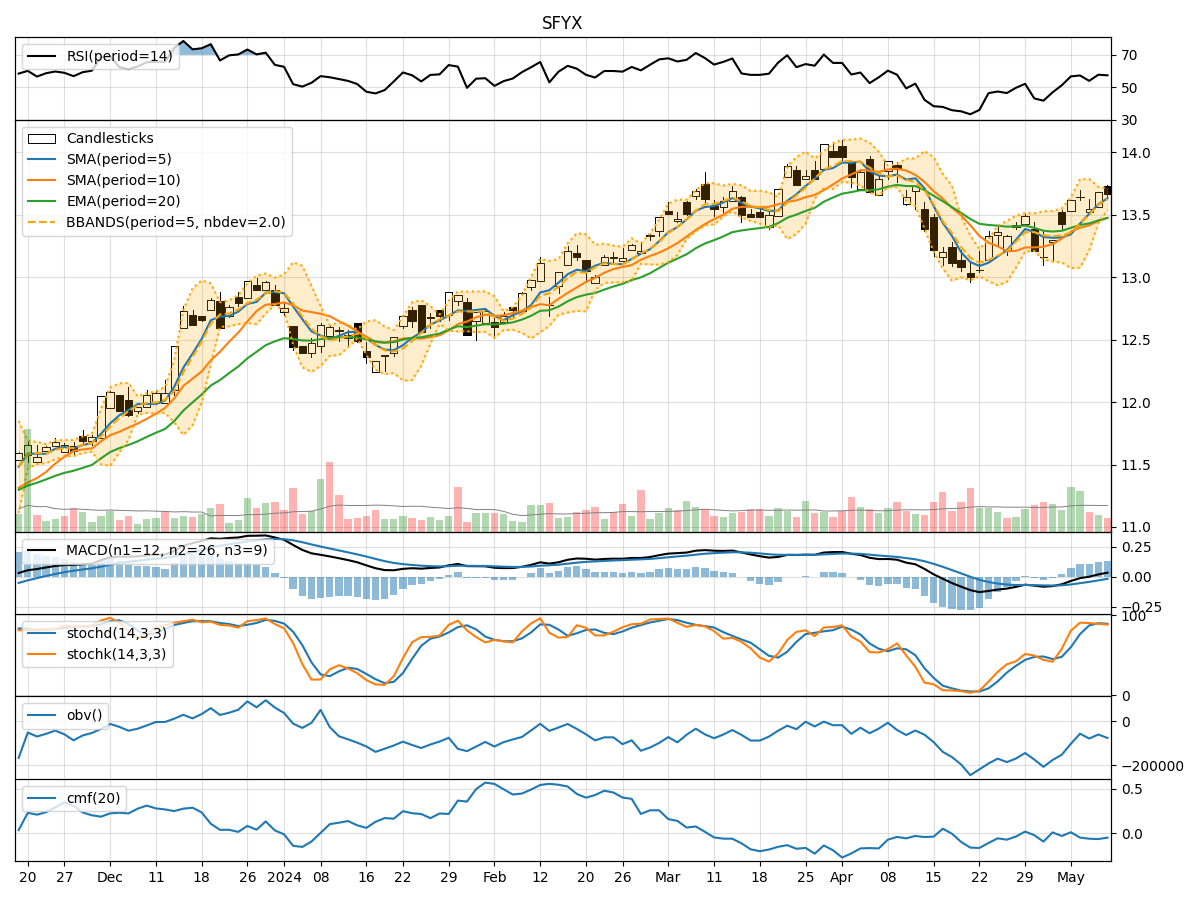
- Moving Averages (MA): The 5-day Moving Average (MA) has been consistently above the closing prices, indicating a bullish trend.
- MACD: The MACD line has been consistently above the signal line, suggesting a bullish momentum.
- Relative Strength Index (RSI): RSI values have been fluctuating around the 50 level, indicating a neutral stance.
Momentum Analysis:
- Stochastic Oscillator: Both %K and %D values have been relatively high, signaling overbought conditions.
- Williams %R (WillR): The Williams %R values have been negative, indicating a potential oversold condition.
Volatility Analysis:
- Bollinger Bands (BB): The stock price has been trading within the Bollinger Bands, with the bands narrowing, suggesting a decrease in volatility.
- Bollinger Band %B (BBP): The %B values have been decreasing, indicating a potential consolidation phase.
Volume Analysis:
- On-Balance Volume (OBV): The OBV values have been mixed, reflecting indecision among market participants.
- Chaikin Money Flow (CMF): The CMF values have been negative, indicating selling pressure.
Conclusion:
Based on the analysis of the technical indicators, the stock is likely to experience sideways movement in the coming days. The bullish trend indicated by moving averages and MACD may be offset by the overbought conditions highlighted by the Stochastic Oscillator. The narrowing Bollinger Bands and negative CMF suggest a lack of strong buying interest. Therefore, it is advisable to exercise caution and closely monitor the price action for potential entry or exit points.
In summary, the stock is expected to trade within a consolidation range in the near term, with limited upside potential. Traders should wait for clearer signals or confirmation of a new trend before making significant trading decisions.