Technical Analysis of SGLC 2024-05-10
Overview:
In analyzing the technical indicators for SGLC over the last 5 days, we will delve into the trend, momentum, volatility, and volume indicators to provide a comprehensive outlook on the possible stock price movement. By examining these key aspects, we aim to offer valuable insights and predictions for the upcoming days.
Trend Analysis:
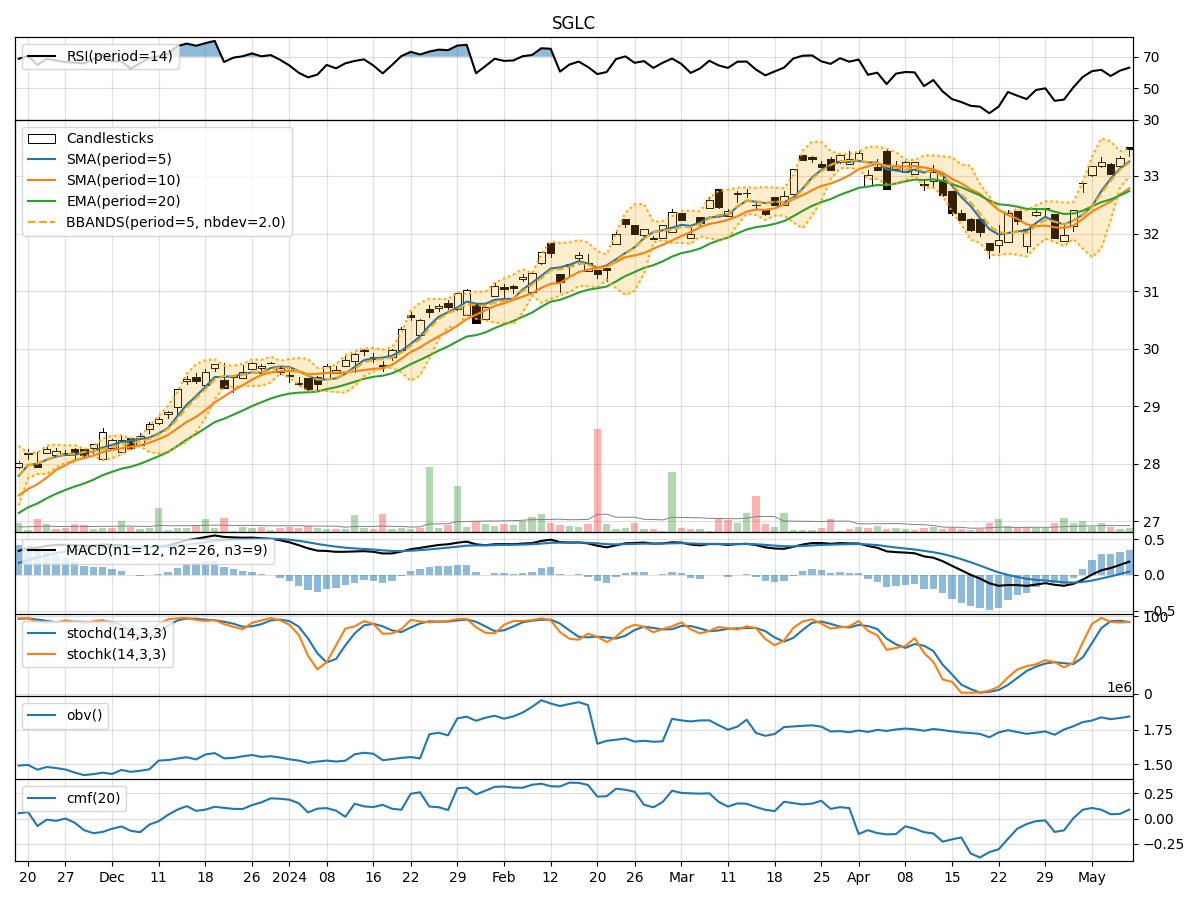
- Moving Averages (MA): The 5-day MA has been consistently above the closing prices, indicating a bullish trend.
- MACD: The MACD line has been above the signal line, suggesting a bullish momentum.
- RSI: The RSI values have been in the range of 50-70, indicating a neutral to slightly bullish sentiment.
Key Observation: The trend indicators suggest a bullish outlook for SGLC.
Momentum Analysis:
- Stochastic Oscillator: The Stochastic Oscillator values have been fluctuating around the overbought territory, indicating potential for a reversal.
- Williams %R: The Williams %R values have been hovering around oversold levels, suggesting a possible buying opportunity.
Key Observation: Momentum indicators show mixed signals with a slight bias towards a potential reversal.
Volatility Analysis:
- Bollinger Bands: The stock price has been trading within the Bollinger Bands, indicating a period of consolidation.
- Volatility Percentage (BBP): The BBP values have been fluctuating around 0.5, suggesting moderate volatility.
Key Observation: Volatility indicators point towards a period of consolidation and stability.
Volume Analysis:
- On-Balance Volume (OBV): The OBV values have been negative, indicating distribution.
- Chaikin Money Flow (CMF): The CMF values have been positive but decreasing, signaling weakening buying pressure.
Key Observation: Volume indicators suggest a bearish sentiment with decreasing buying pressure.
Conclusion:
Based on the analysis of the technical indicators, the next few days for SGLC could see sideways movement with a slight bearish bias. The trend indicators support a bullish outlook, while momentum indicators show signs of a potential reversal. Volatility indicators point towards consolidation, and volume indicators indicate a bearish sentiment with weakening buying pressure.
Recommendation: It is advisable to closely monitor the price action and key support/resistance levels for potential entry or exit points. Consider implementing risk management strategies to navigate the market uncertainties effectively.